Question: Demand Analysis Calculating Market Demand The Industry Demand Analysis will help the Marketing and Production Departments understand future demand. Marketing can use the total demand
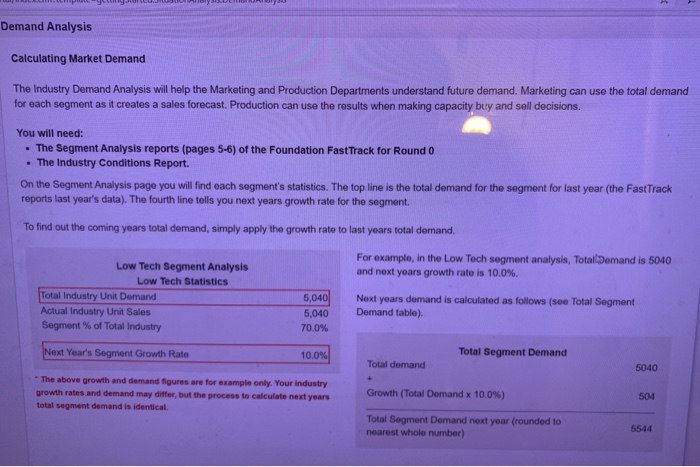
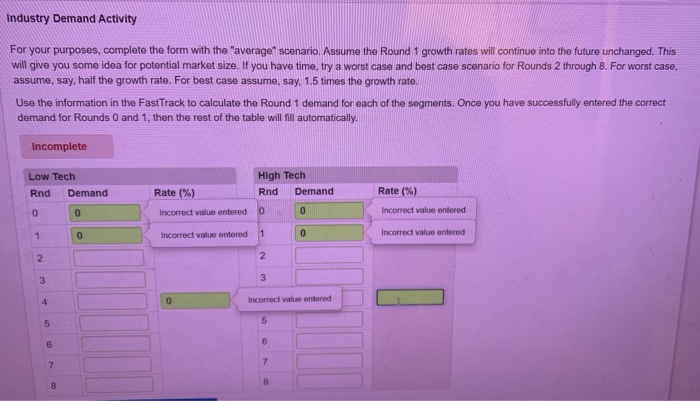
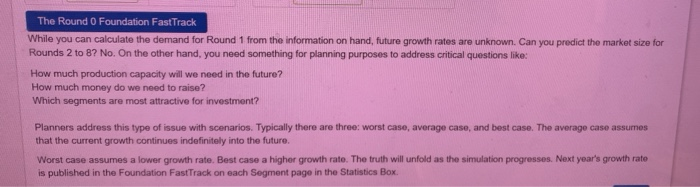
Demand Analysis Calculating Market Demand The Industry Demand Analysis will help the Marketing and Production Departments understand future demand. Marketing can use the total demand for each segment as it creates a sales forecast. Production can use the results when making capacity buy and sell decisions. You will need: . The Segment Analysis reports (pages 5-6) of the Foundation Fast Track for Round 0 . The Industry Conditions Report On the Segment Analysis page you will find each segment's statistics. The top line is the total demand for the segment for last year (the FastTrack reports last year's data). The fourth line tells you next years growth rate for the segment To find out the coming years total demand, simply apply the growth rate to last years total demand, For example, in the Low Tech segment analysis, Total Demand is 5040 and next years growth rate is 10.0% Low Tech Segment Analysis Low Tech Statistics Total Industry Unit Demand Actual Industry Unit Sales Segment % of Total Industry 5,040 5,040 70.0% Next years demand is calculated as follows (see Total Segment Demand table) Next Year's Segment Growth Rate 10.0% Total Segment Demand Total demand 5040 The above growth and demand figures are for example only. Your industry growth rates and demand may differ, but the process to calculate next years total segment demand is identical Growth (Total Demand x 10.0%) 504 Total Segment Demand next year (rounded to nearest whole number) 5544 Industry Demand Activity For your purposes, complete the form with the "average scenario. Assume the Round 1 growth rates will continue into the future unchanged. This will give you some idea for potential market size. If you have time, try a worst case and best case scenario for Rounds 2 through 8. For worst case, assume, say, half the growth rate. For best case assume, say, 1.5 times the growth rate. Use the information in the FastTrack to calculate the Round 1 demand for each of the segments. Once you have successfully entered the correct demand for Rounds 0 and 1, then the rest of the table will fill automatically. Incomplete Low Tech Rnd Demand High Tech Rnd Demand Rate(%) Rate(%) 0 0 Incorrect value entered 0 0 Incorrect value entered 1 0 Incorrect value entered 1 0 Incorrect value entered 2. 2 3 3 4 Incorrect value entered 5 5 6 6 7 7 The Round O Foundation Fast Track While you can calculate the demand for Round 1 from the information on hand, future growth rates are unknown. Can you predict the market size for Rounds 2 to 8? No. On the other hand, you need something for planning purposes to address critical questions like: How much production capacity will we need in the future? How much money do we need to raise? Which segments are most attractive for investment? Planners address this type of issue with scenarios. Typically there are three: worst case, average case, and best case. The average case assumes that the current growth continues indefinitely into the future. Worst case assumes a lower growth rate. Best case a higher growth rate. The truth will unfold as the simulation progresses. Next year's growth rate is published in the Foundation Fast Track on each Segment page in the Statistics Box