

Question: please help solve for : 1. 6 FREQUENCY DISTRIBUTION RELATIVE FREQUENCY DISTRIBUTION You survey several South King County restaurants (nice places) and gather the following
please help solve for :
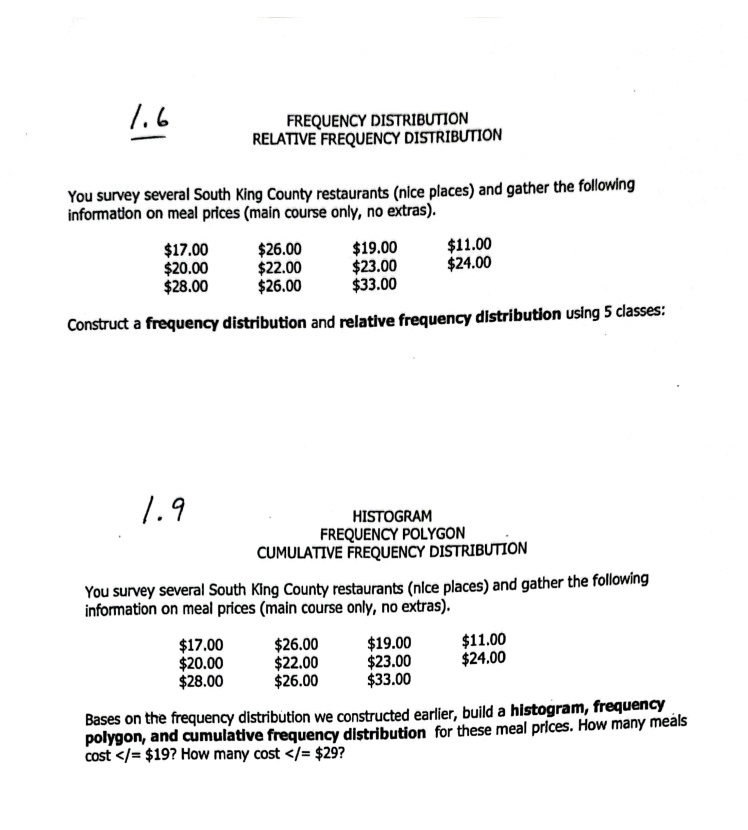
1. 6 FREQUENCY DISTRIBUTION RELATIVE FREQUENCY DISTRIBUTION You survey several South King County restaurants (nice places) and gather the following information on meal prices (main course only, no extras). $17.00 $26.00 $19.00 $11.00 $20.00 $22.00 $23.00 $24.00 $28.00 $26.00 $33.00 Construct a frequency distribution and relative frequency distribution using 5 classes: 1.9 HISTOGRAM FREQUENCY POLYGON CUMULATIVE FREQUENCY DISTRIBUTION You survey several South King County restaurants (nice places) and gather the following information on meal prices (main course only, no extras). $17.00 $26.00 $19.00 $11.00 $20.00 $22.00 $23.00 $24.00 $28.00 $26.00 $33.00 Bases on the frequency distribution we constructed earlier, build a histogram, frequency polygon, and cumulative frequency distribution for these meal prices. How many meals cost = $19? How many cost = $29
Step by Step Solution
There are 3 Steps involved in it

Get step-by-step solutions from verified subject matter experts