

Question: please help solve the missing balances Question 3 Not complete Marked out of 55.00 V Flag question Forecasting and Estimating Share Value Using the DCF
please help solve the missing balances
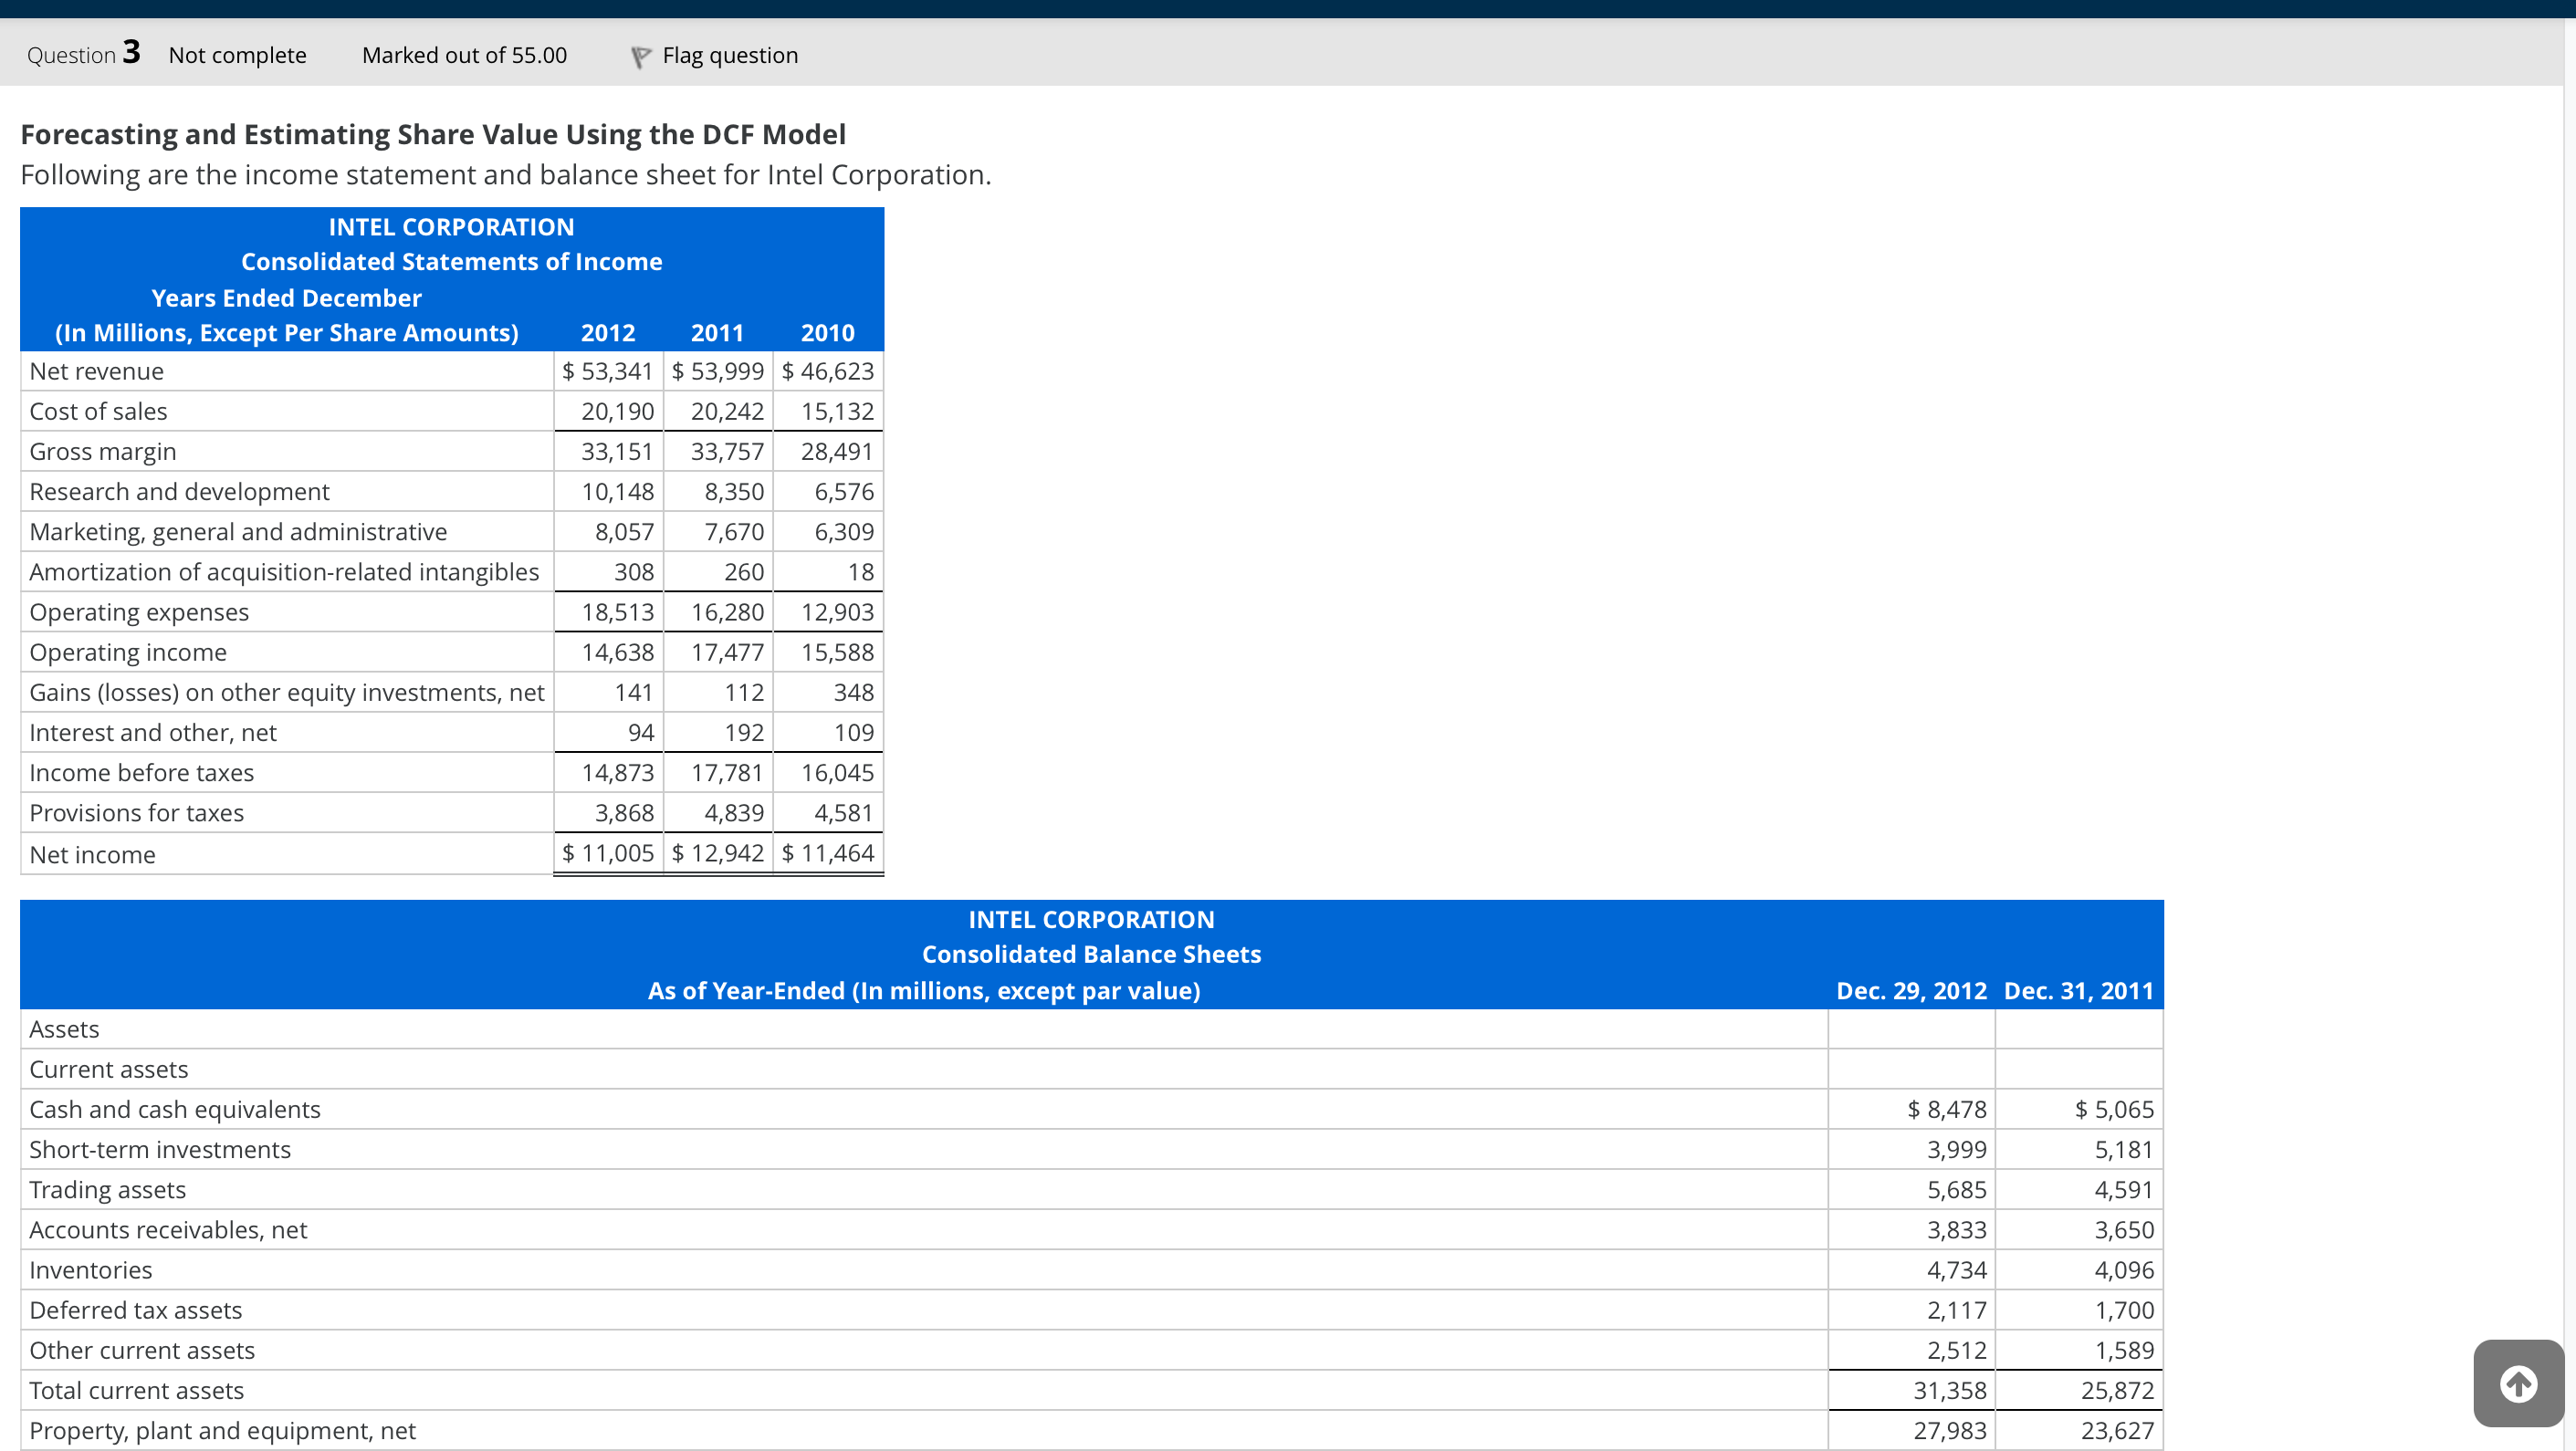
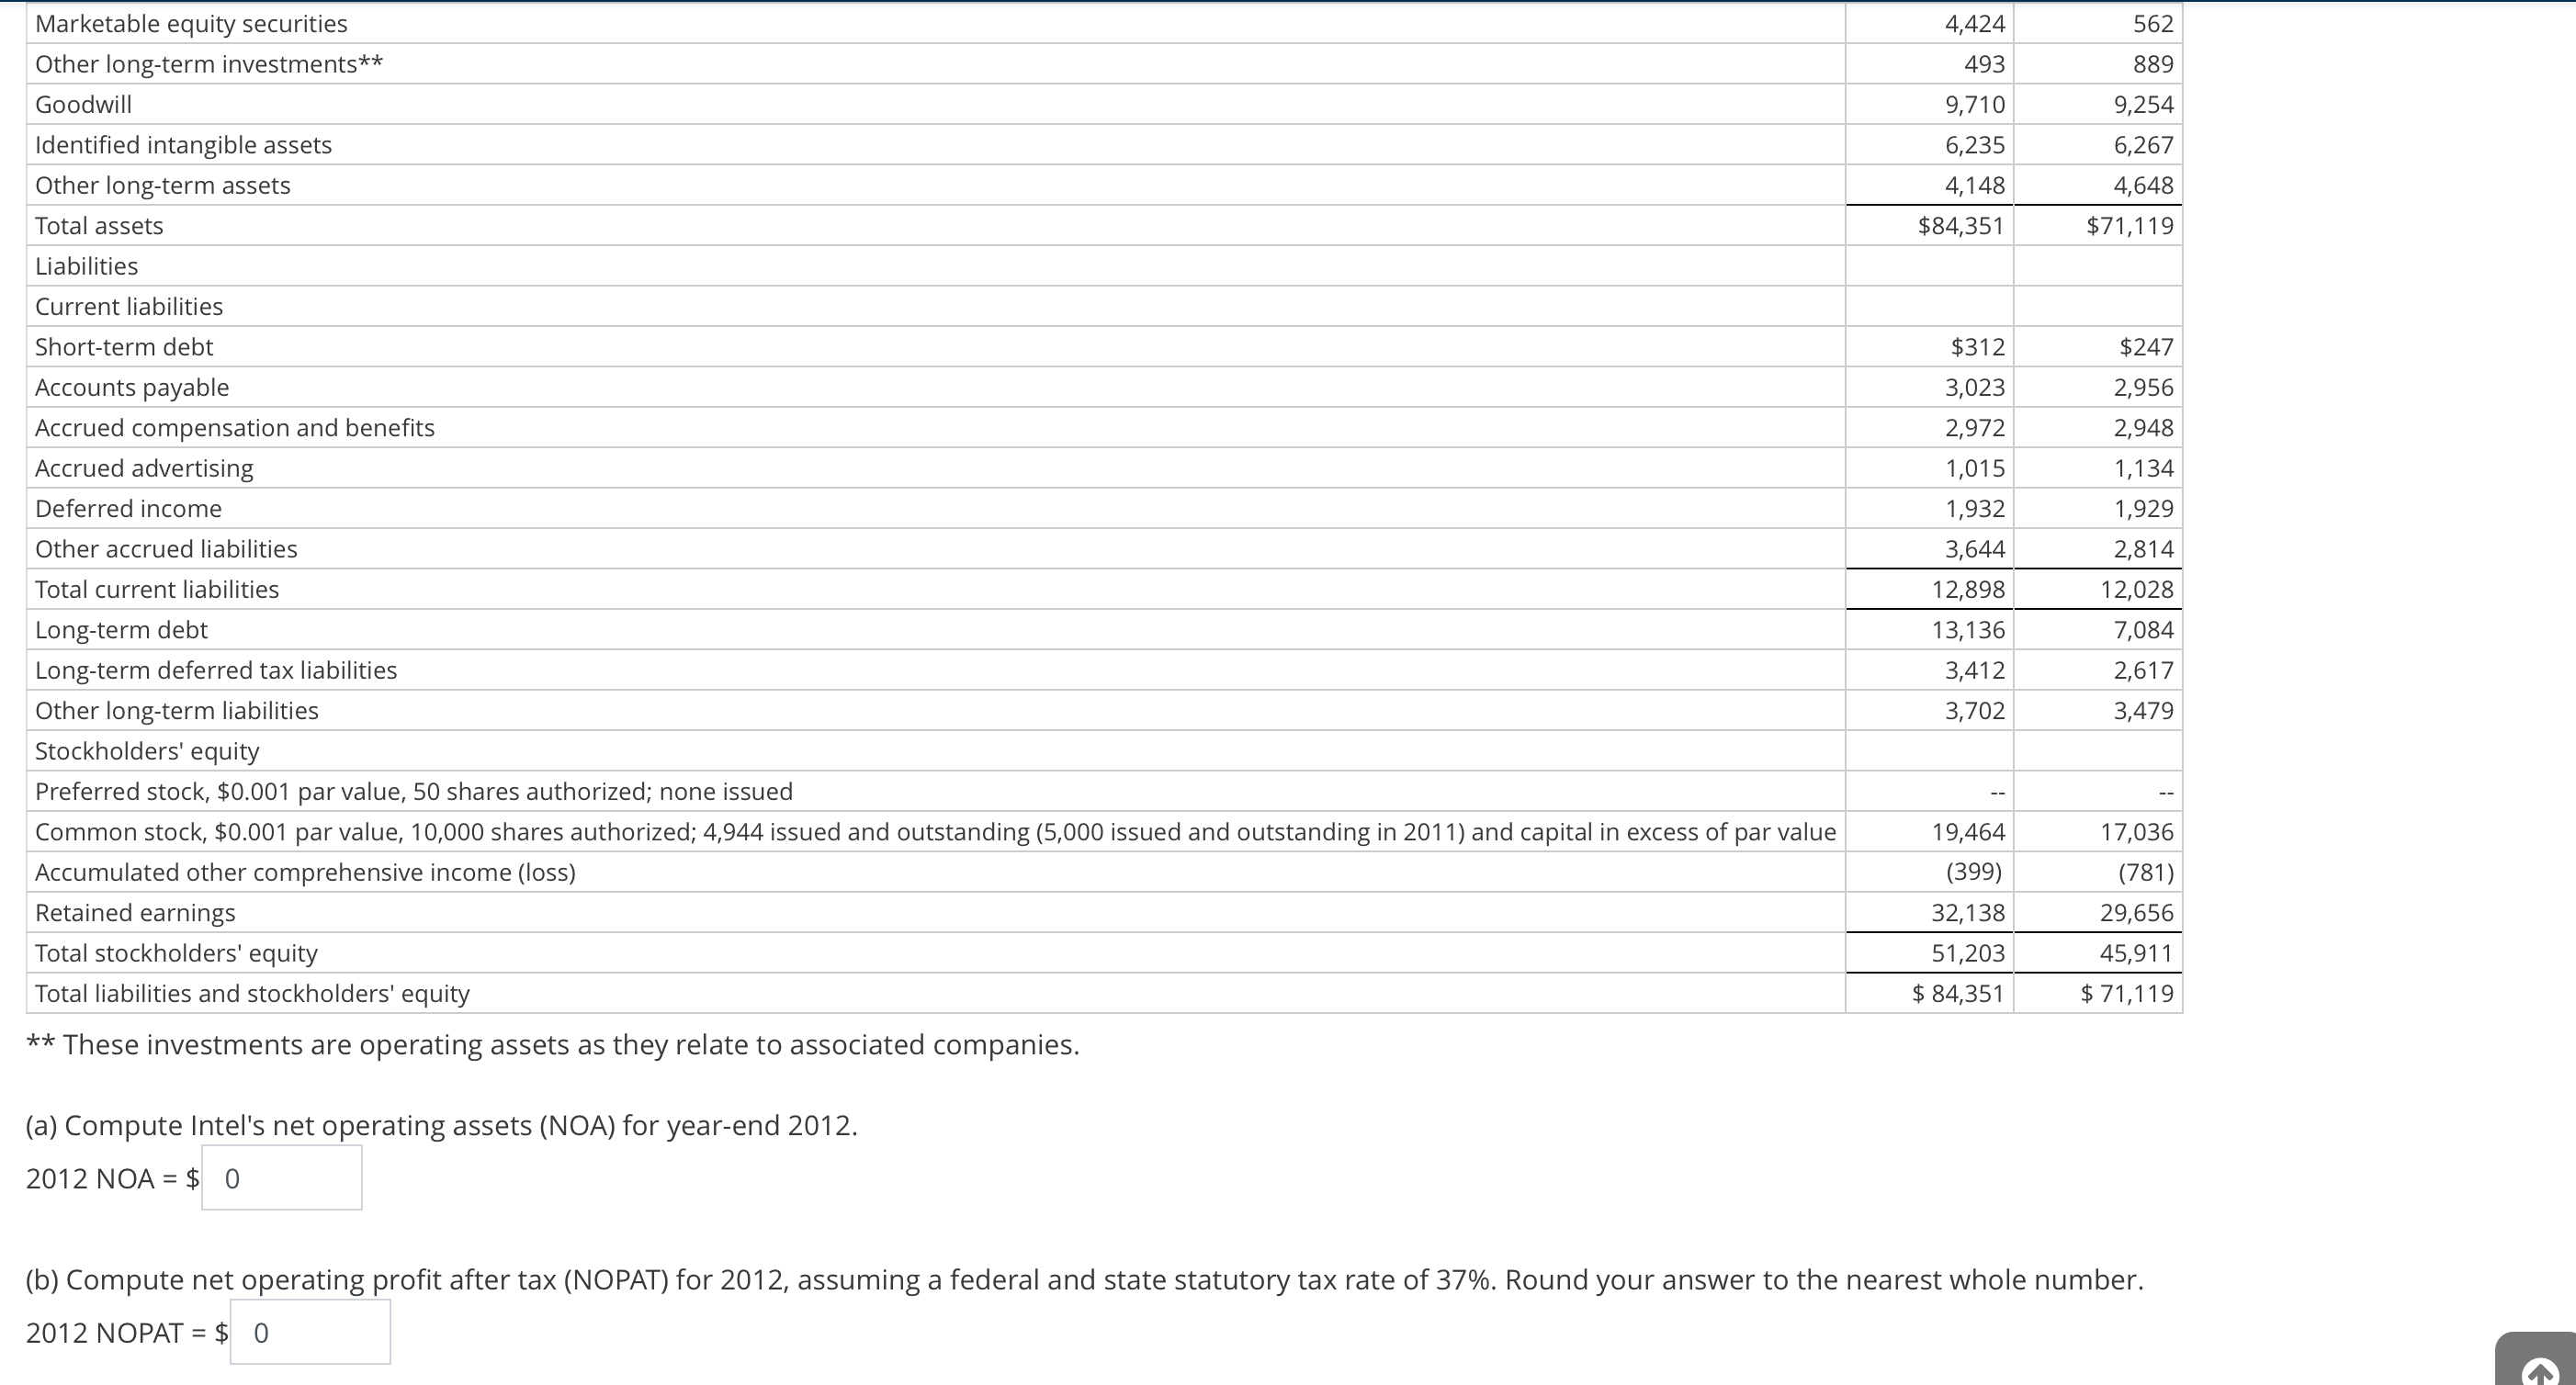
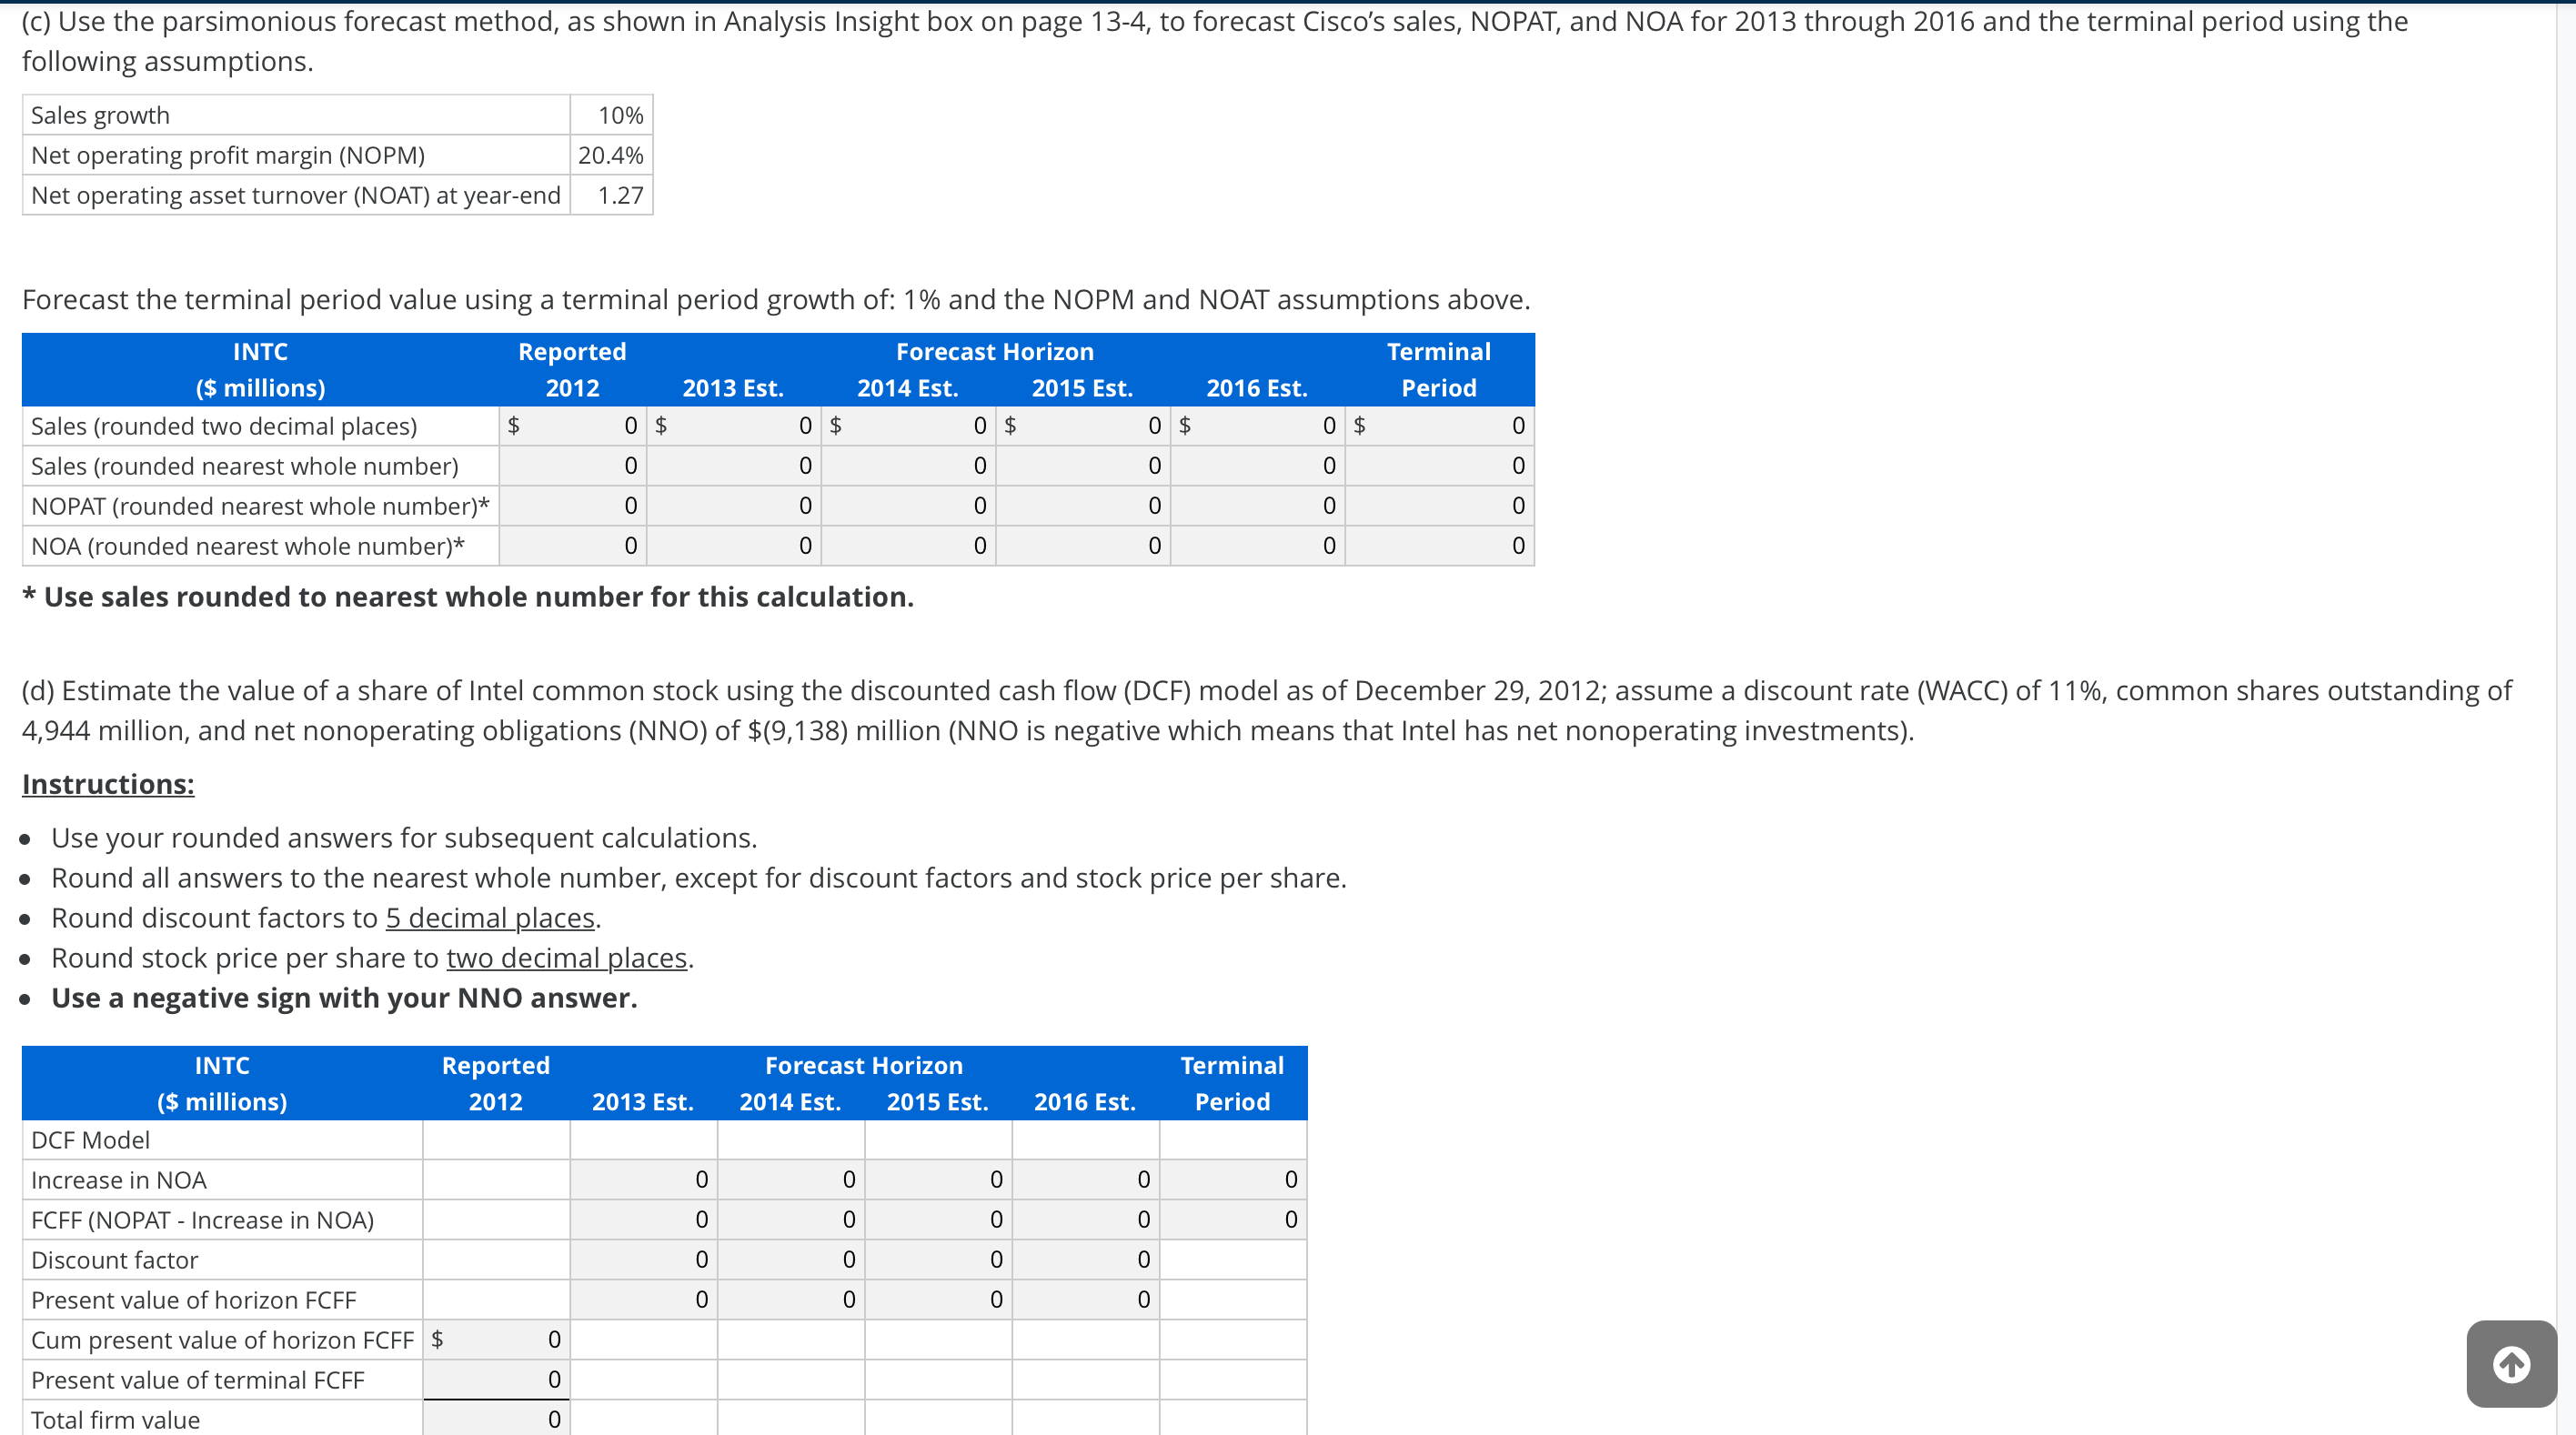

Question 3 Not complete Marked out of 55.00 V Flag question Forecasting and Estimating Share Value Using the DCF Model Following are the income statement and balance sheet for Intel Corporation. INTEL CORPORATION Consolidated Statements of Income Years Ended December (In Millions, Except Per Share Amounts) Net revenue 2012 2011 2010 l $ 53,341 ls 53,999 $ 46,623 I 20,242' 15,132] Gross margin l 33,757' 28,491 ' Research and development ' 8,350' 6,576 , Marketing, general and administrative ' 8,057' 7,670' 6,309, l l l l Cost of sales Amortization ofacquisition-related intangibles 260' 18 Operating expenses 16,280' 12,903 Operating income 17,477' 15,588 , Gains (losses) on other equity investments, net 112' 3481 Interest and other, net 7 94 1927 109 ' Income before taxes 14,873 17,781 16,045 3,868 4,839 4,581 ' 511,005 $ 12,942 $11,464 ,141 l Provisions for taxes Net income INTEL CORPORATION Consolidated Balance Sheets As onear-Ended (In millions, except par value) Dec. 29, 2012 Dec. 31, 2011 Assets ' Current assets ' Cash and cash equivalents $ 8,478' 3 5,065 Short-term investments 3,999' 5,181 Trading assets 5,685' 4,591 Accounts receivables, net 3,833' 3,650 Inventories 4,734 I 4,096 Deferred tax assets 2,1 17 ' 1,700 Other current assets 2,512 I 1,589 Total current assets 31,358' 25,872 Property, plant and equipment, net 27,983' 23,627 Marketable equity securities 4,424 562 Other long-term investments** 493 889 Goodwill 9,710 9,254 Identified intangible assets 6,235 6,267 Other long-term assets 4, 148 4,648 Total assets $84,351 $71, 119 Liabilities Current liabilities Short-term debt $312 $247 Accounts payable 3,023 2,956 Accrued compensation and benefits 2,972 2,948 Accrued advertising 1,015 1,134 Deferred income 1,932 1,929 Other accrued liabilities 3,644 2, 814 Total current liabilities 12,898 12,028 Long-term debt 13, 136 7,084 Long-term deferred tax liabilities 3,412 2,617 Other long-term liabilities 3,702 3,479 Stockholders' equity Preferred stock, $0.001 par value, 50 shares authorized; none issued Common stock, $0.001 par value, 10,000 shares authorized; 4,944 issued and outstanding (5,000 issued and outstanding in 2011) and capital in excess of par value 19,464 17,036 Accumulated other comprehensive income (loss) (399) (781) Retained earnings 32, 138 29,656 Total stockholders' equity 51,203 45,911 Total liabilities and stockholders' equity $ 84,351 $ 71, 1 19 ** These investments are operating assets as they relate to associated companies. (a) Compute Intel's net operating assets (NOA) for year-end 2012. 2012 NOA = $ 0 (b) Compute net operating profit after tax (NOPAT) for 2012, assuming a federal and state statutory tax rate of 37%. Round your answer to the nearest whole number. 2012 NOPAT = $ 0(c) Use the parsimonious forecast method, as shown in Analysis Insight box on page 13-4, to forecast Cisco's sales, NOPAT, and NOA for 2013 through 2016 and the terminal period using the following assumptions. Sales growth 10% Net operating profit margin (NOPM) 20.4% Net operating asset turnover (NOAT) at year-end 1.27 Forecast the terminal period value using a terminal period growth of: 1% and the NOPM and NOAT assumptions above. INTC Reported Forecast Horizon Terminal ($ millions 2012 2013 Est. 2014 Est. 2015 Est. 2016 Est. Period Sales (rounded two decimal places) $ 0 $ 0 $ 0 $ 0 $ 0 $ 0 Sales (rounded nearest whole number) O 0 NOPAT (rounded nearest whole number)* ooo O ooo ooo o o o o NOA (rounded nearest whole number)* 0 * Use sales rounded to nearest whole number for this calculation. (d) Estimate the value of a share of Intel common stock using the discounted cash flow (DCF) model as of December 29, 2012; assume a discount rate (WACC) of 11%, common shares outstanding of 4,944 million, and net nonoperating obligations (NNO) of $(9,138) million (NNO is negative which means that Intel has net nonoperating investments). Instructions: Use your rounded answers for subsequent calculations. Round all answers to the nearest whole number, except for discount factors and stock price per share. Round discount factors to 5 decimal places. Round stock price per share to two decimal places. Use a negative sign with your NNO answer. INTC Reported Forecast Horizon Terminal ($ millions) 2012 2013 Est. 2014 Est. 2015 Est. 2016 Est. Period DCF Model Increase in NOA O FCFF (NOPAT - Increase in NOA) 0 ooo o oo oo o o o O oo oo Discount factor Present value of horizon FCFF Cum present value of horizon FCFF $ o O Present value of terminal FCFF Total firm value 0NNO Firm equity value Shares outstanding (millions) Stock price per share 000
Step by Step Solution
There are 3 Steps involved in it

Get step-by-step solutions from verified subject matter experts