

Question: For this question pertaining to estimating share value using the DCF model, please show me how to solve for the NOA, NOPAT, and FCFF Terminal
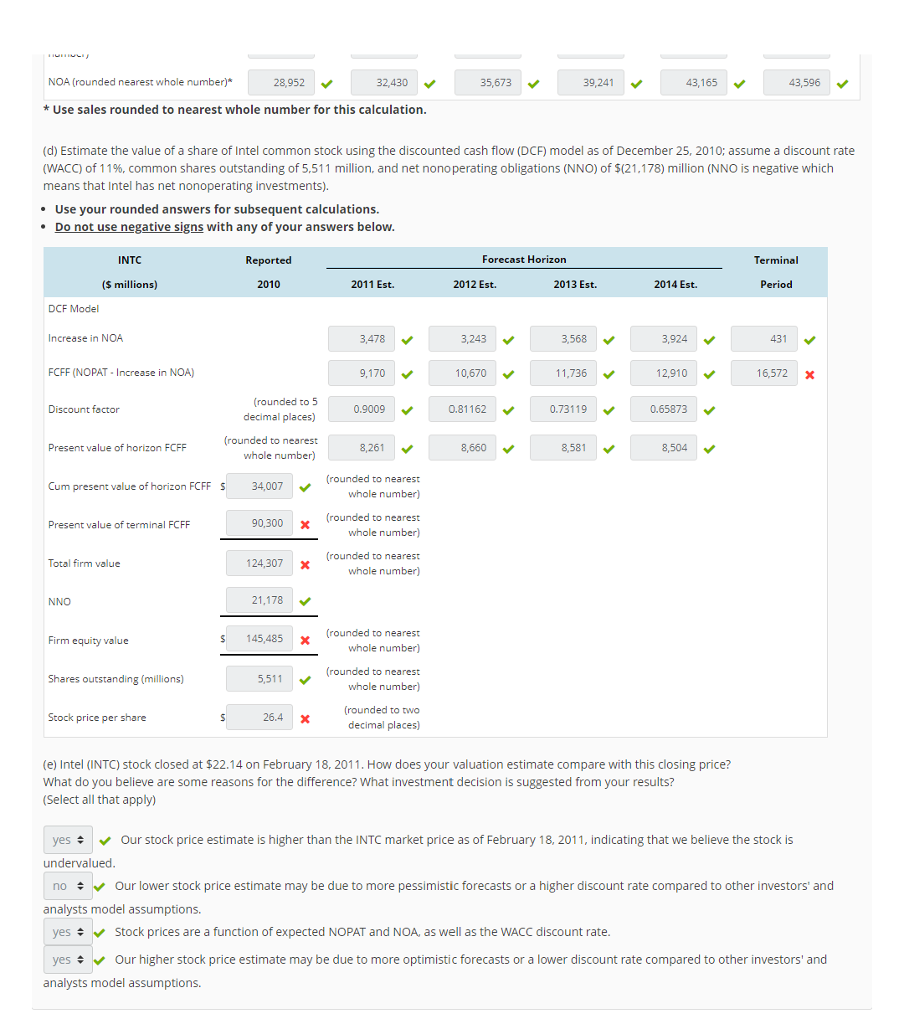
For this question pertaining to estimating share value using the DCF model, please show me how to solve for the NOA, NOPAT, and FCFF Terminal Period. Please solve the problem in its entirity and show your steps to your calculations.
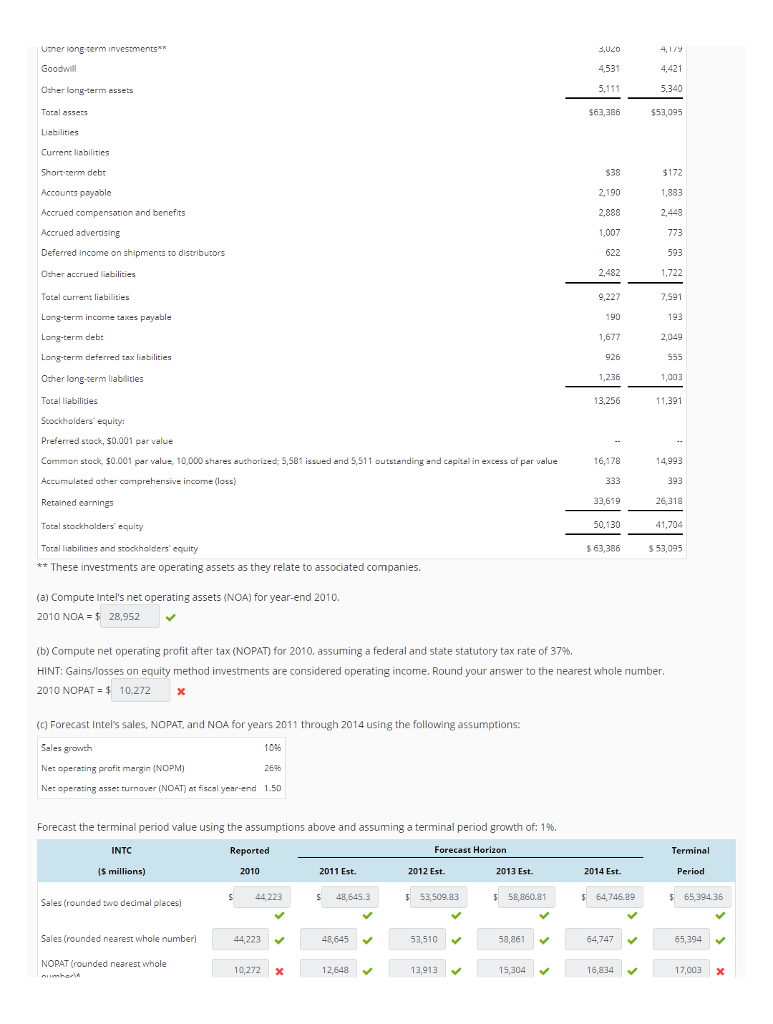
NOA = $28,952 (I still want to know how to solve this)
NOPAT = $11,850
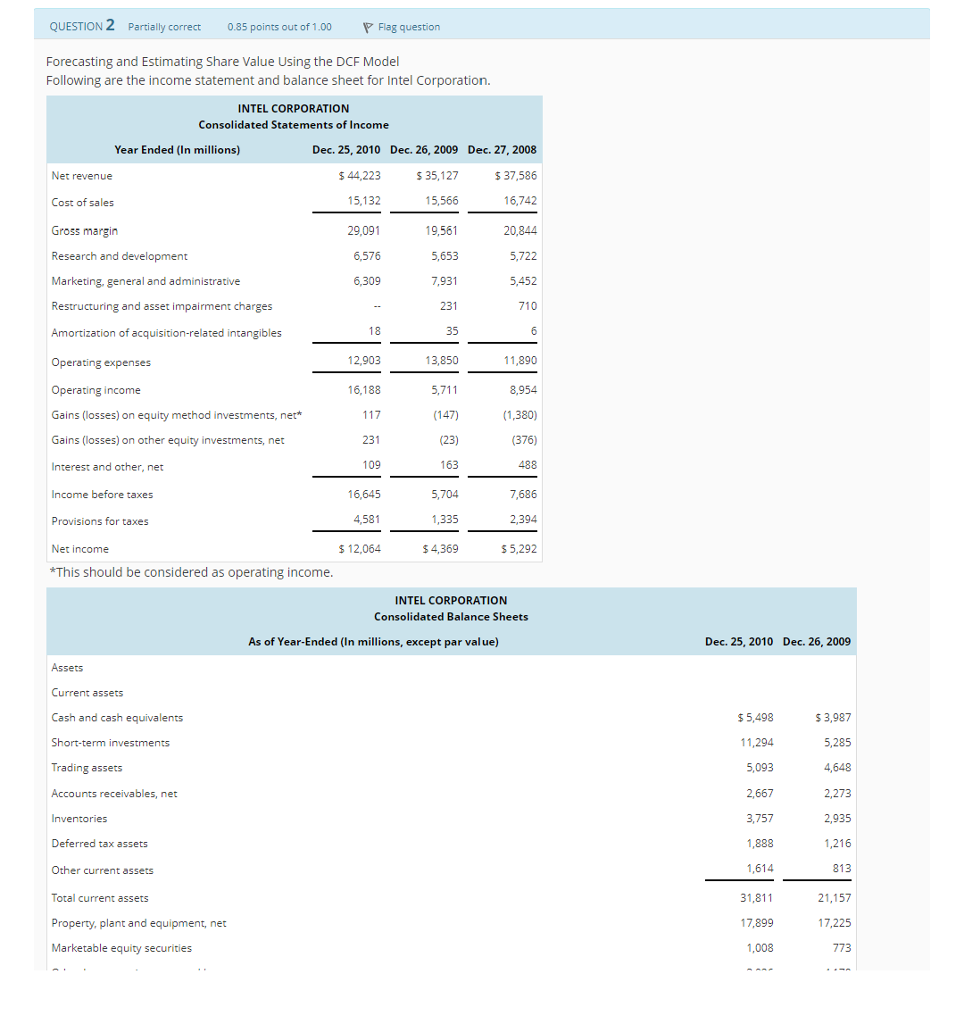
QUESTION 2 Partially correct 0.85 points out of 1.00 Flag question Forecasting and Estimating Share Value Using the DCF Model Following are the income statement and balance sheet for Intel Corporation. INTEL CORPORATION Consolidated Statements of Income Year Ended (In millions) Dec. 25, 2010 $ 44,223 15,132 29,091 6,576 6,309 Dec. 26, 2009 35,127 15,566 19,561 5,653 7,931 231 35 13,850 5,711 (147) (23) 163 5,704 1,335 4,369 Dec. 27, 2008 $ 37,586 16,742 20,844 5,722 5,452 710 Net revenue Cost of sales Gross margin Research and development Marketing. general and administrative Restructuring and asset impairment charges Amortization of acquisition-related intangibles Operating expenses Operating income Gains (losses) on equity method investments, net* Gains (losses) on other equity investments, net Interest and other, net Income before taxes Provisions for taxes Net income *This should be considered as operating income 12,903 11,890 8,954 (1,380) (376) 488 7,686 2,394 S 5,292 16,188 231 109 16,645 4,581 12,064 INTEL CORPORATION Consolidated Balance Sheets As of Year-Ended (In millions, except par value) Dec. 25, 2010 Dec. 26, 2009 Assets Current assets 3,987 5,285 4,648 2,273 2,935 1,216 813 21,157 17,225 773 Cash and cash equivalents Short-term investments Trading assets Accounts receivables, net $5,498 11,294 5,093 2,667 3,757 1,888 Deferred tax assets Other current assets Total current assets Property, plant and equipment, net Marketable equity securities 31,811 17,899 1,008 QUESTION 2 Partially correct 0.85 points out of 1.00 Flag question Forecasting and Estimating Share Value Using the DCF Model Following are the income statement and balance sheet for Intel Corporation. INTEL CORPORATION Consolidated Statements of Income Year Ended (In millions) Dec. 25, 2010 $ 44,223 15,132 29,091 6,576 6,309 Dec. 26, 2009 35,127 15,566 19,561 5,653 7,931 231 35 13,850 5,711 (147) (23) 163 5,704 1,335 4,369 Dec. 27, 2008 $ 37,586 16,742 20,844 5,722 5,452 710 Net revenue Cost of sales Gross margin Research and development Marketing. general and administrative Restructuring and asset impairment charges Amortization of acquisition-related intangibles Operating expenses Operating income Gains (losses) on equity method investments, net* Gains (losses) on other equity investments, net Interest and other, net Income before taxes Provisions for taxes Net income *This should be considered as operating income 12,903 11,890 8,954 (1,380) (376) 488 7,686 2,394 S 5,292 16,188 231 109 16,645 4,581 12,064 INTEL CORPORATION Consolidated Balance Sheets As of Year-Ended (In millions, except par value) Dec. 25, 2010 Dec. 26, 2009 Assets Current assets 3,987 5,285 4,648 2,273 2,935 1,216 813 21,157 17,225 773 Cash and cash equivalents Short-term investments Trading assets Accounts receivables, net $5,498 11,294 5,093 2,667 3,757 1,888 Deferred tax assets Other current assets Total current assets Property, plant and equipment, net Marketable equity securities 31,811 17,899 1,008
Step by Step Solution
There are 3 Steps involved in it

Get step-by-step solutions from verified subject matter experts