

Question: Please help solve using MATLAB. Please create a code that produces a plot, using 4000 iterations and a small markersize. Your task is to compute
Please help solve using MATLAB. Please create a code that produces a plot, using 4000 iterations and a small markersize.
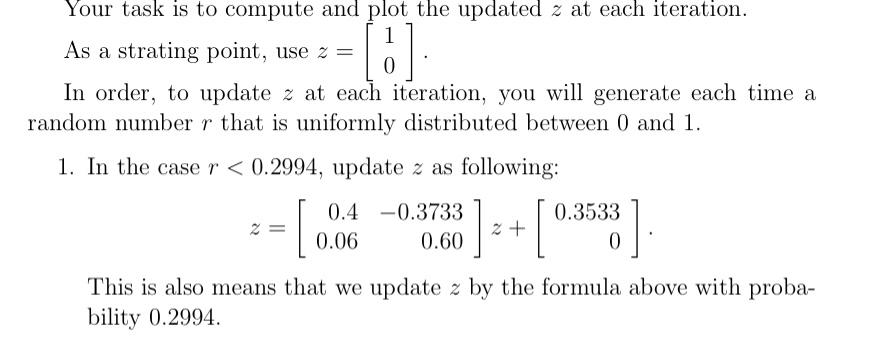
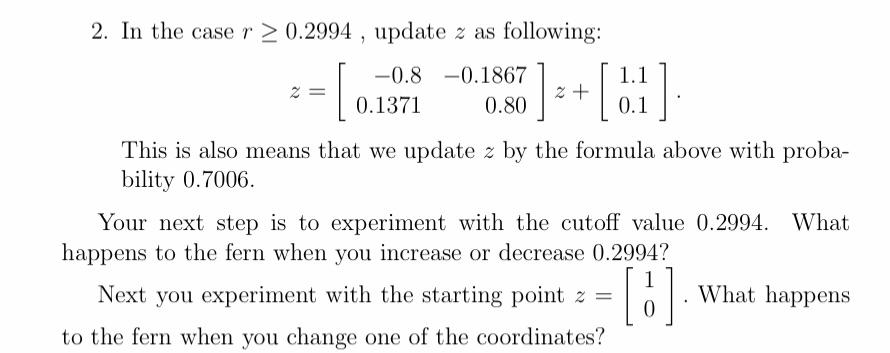
Your task is to compute and plot the updated 2 at each iteration. 1 As a strating point, use z = 0 In order, to update z at each iteration, you will generate each time a random number r that is uniformly distributed between 0 and 1. 1. In the case r 0.2994 , update z as following: 1 -0.8 -0.1867 0.1371 0.80 2+ 1.1 0.1 This is also means that we update 2 by the formula above with proba- bility 0.7006. Your next step is to experiment with the cutoff value 0.2994. What happens to the fern when you increase or decrease 0.2994? Next you experiment with the starting point z = What happens to the fern when you change one of the coordinates? [6]. What Your task is to compute and plot the updated 2 at each iteration. 1 As a strating point, use z = 0 In order, to update z at each iteration, you will generate each time a random number r that is uniformly distributed between 0 and 1. 1. In the case r 0.2994 , update z as following: 1 -0.8 -0.1867 0.1371 0.80 2+ 1.1 0.1 This is also means that we update 2 by the formula above with proba- bility 0.7006. Your next step is to experiment with the cutoff value 0.2994. What happens to the fern when you increase or decrease 0.2994? Next you experiment with the starting point z = What happens to the fern when you change one of the coordinates? [6]. What
Step by Step Solution
There are 3 Steps involved in it

Get step-by-step solutions from verified subject matter experts