

Question: Please help solve using paper and pencil Questions 7 through 11 involve the following data set. Increase in Life Expectancy in the United States during
Please help solve using paper and pencil
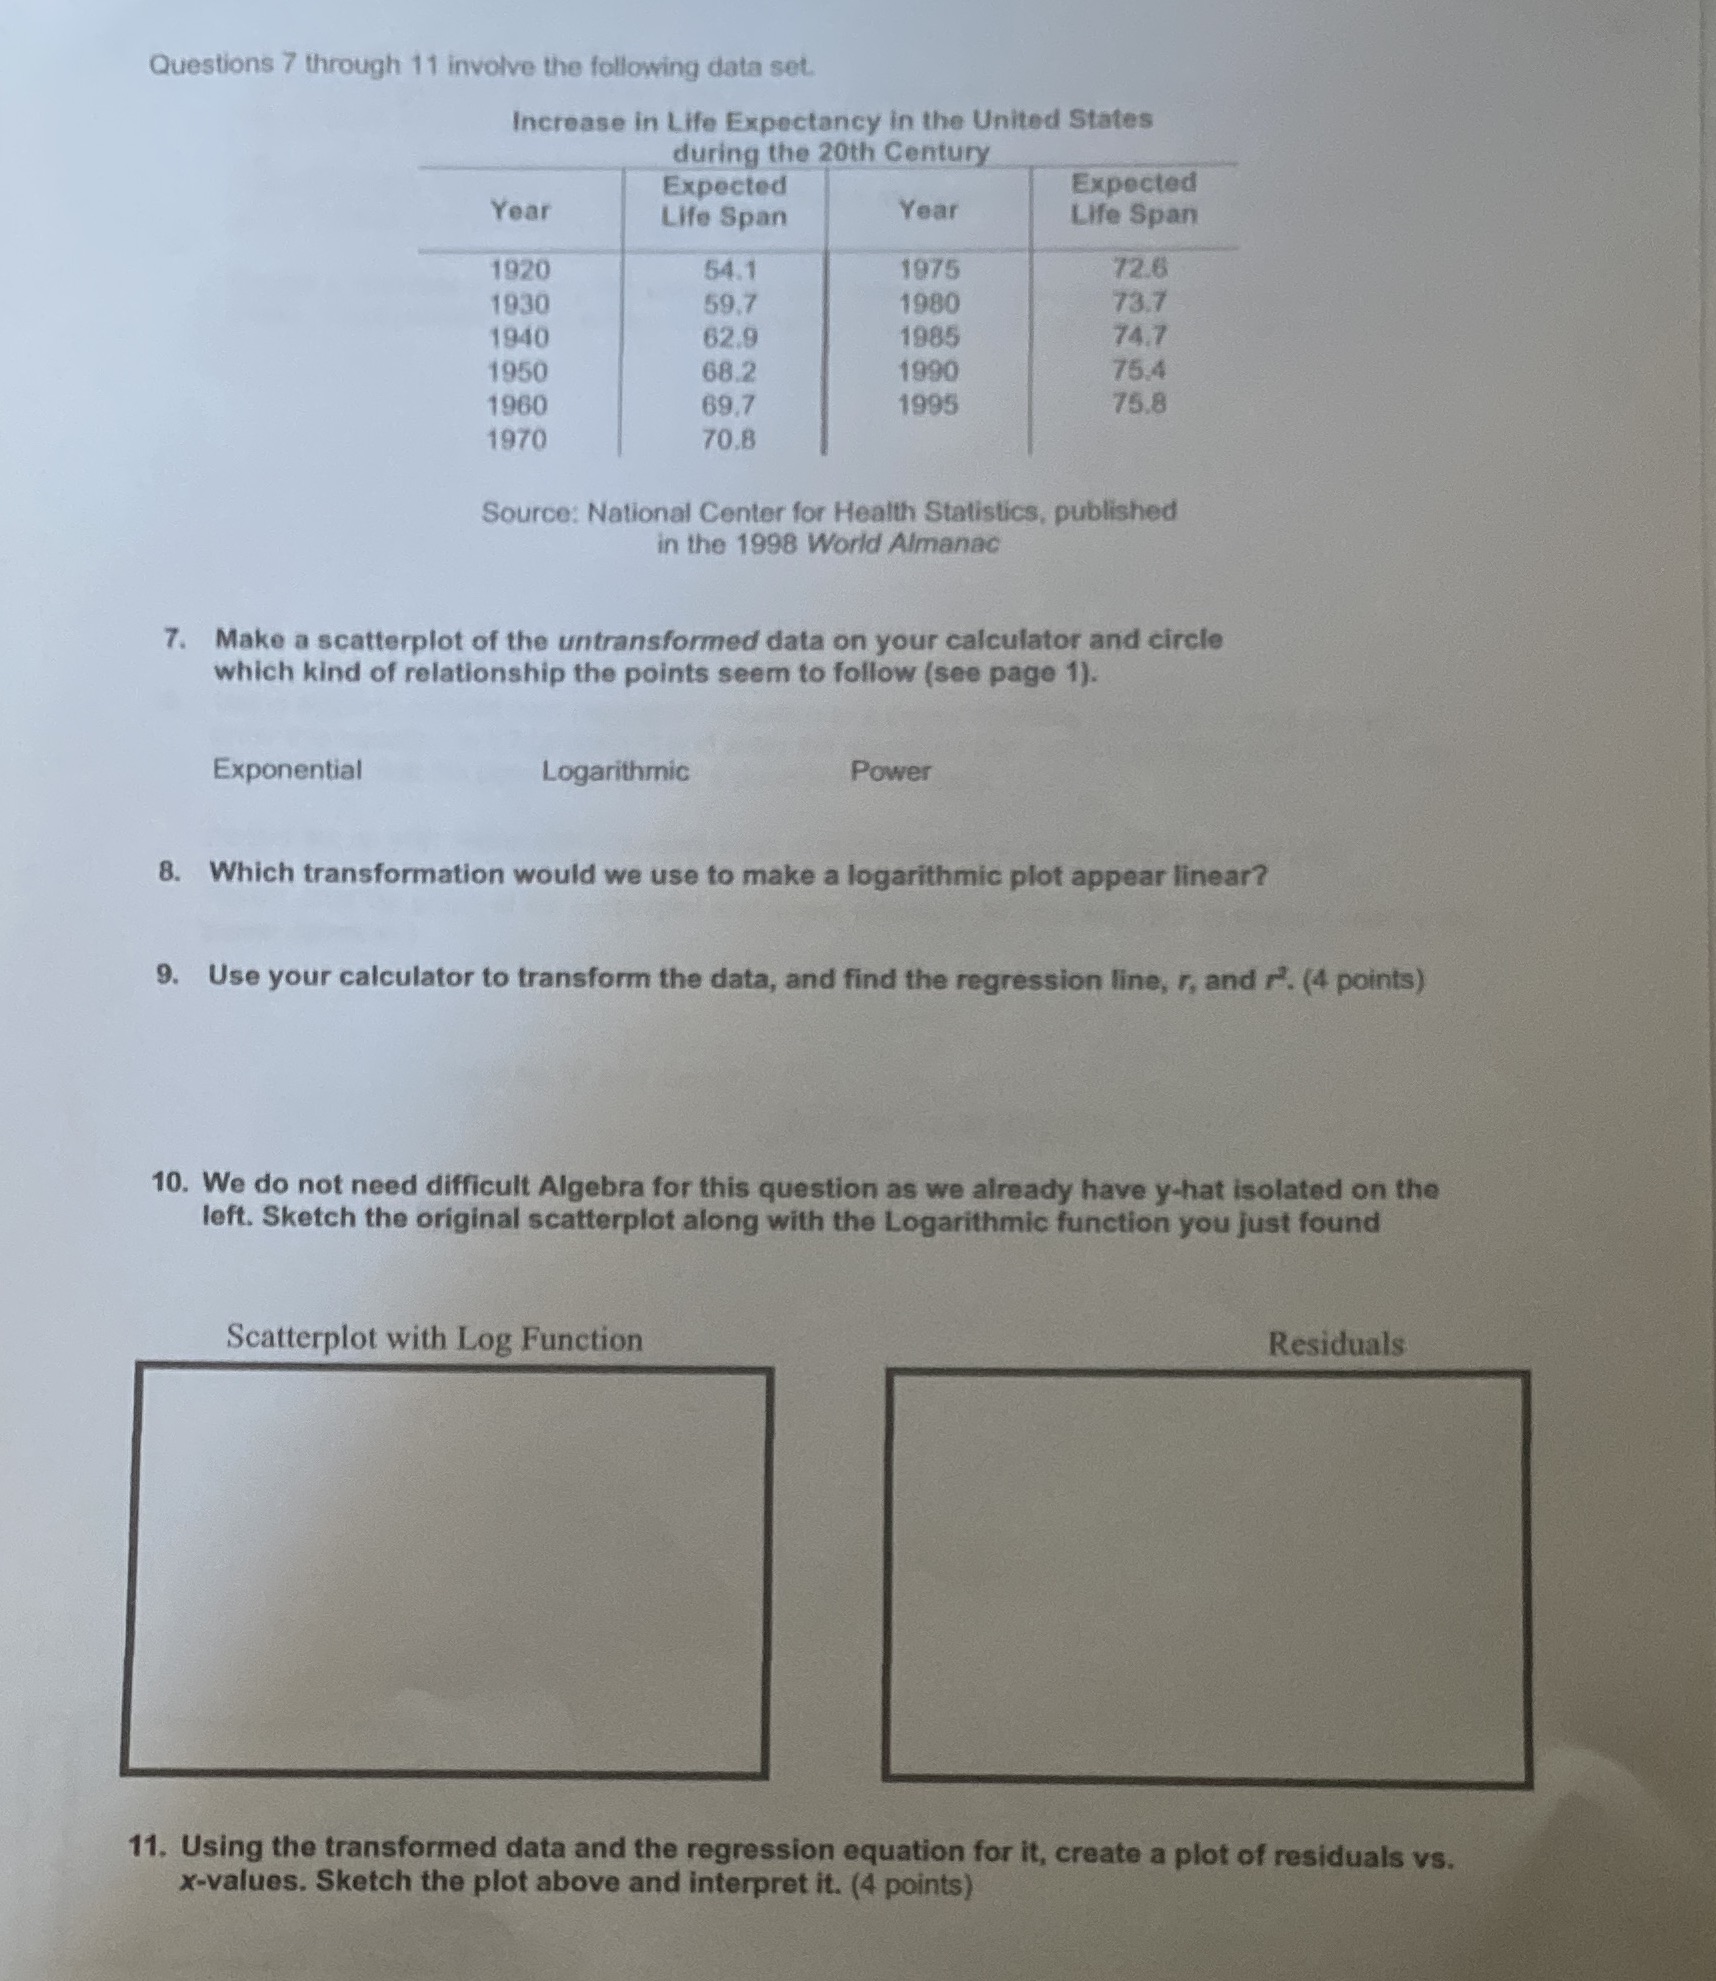
Questions 7 through 11 involve the following data set. Increase in Life Expectancy in the United States during the 20th Century Expected Expected Year Life Span Year Life Span 1920 54.1 1975 72.6 1930 597 1980 73.7 1940 62.9 1985 74.7 1950 68.2 1990 75.4 1960 69.7 1995 75.8 1970 70.8 Source: National Center for Health Statistics, published in the 1998 World Almanac 7. Make a scatterplot of the untransformed data on your calculator and circle which kind of relationship the points seem to follow (see page 1). Exponential Logarithmic Power B. Which transformation would we use to make a logarithmic plot appear linear? 9. Use your calculator to transform the data, and find the regression line, r, and r. (4 points) 10. We do not need difficult Algebra for this question as we already have y-hat isolated on the left. Sketch the original scatterplot along with the Logarithmic function you just found Scatterplot with Log Function Residuals 11. Using the transformed data and the regression equation for it, create a plot of residuals vs. x-values. Sketch the plot above and interpret it. (4 points)
Step by Step Solution
There are 3 Steps involved in it

Get step-by-step solutions from verified subject matter experts