

Question: Can someone please help me with my assignment I've been struggling thank you so much Increase In Life Expectancy In the United States during the
Can someone please help me with my assignment I've been struggling thank you so much
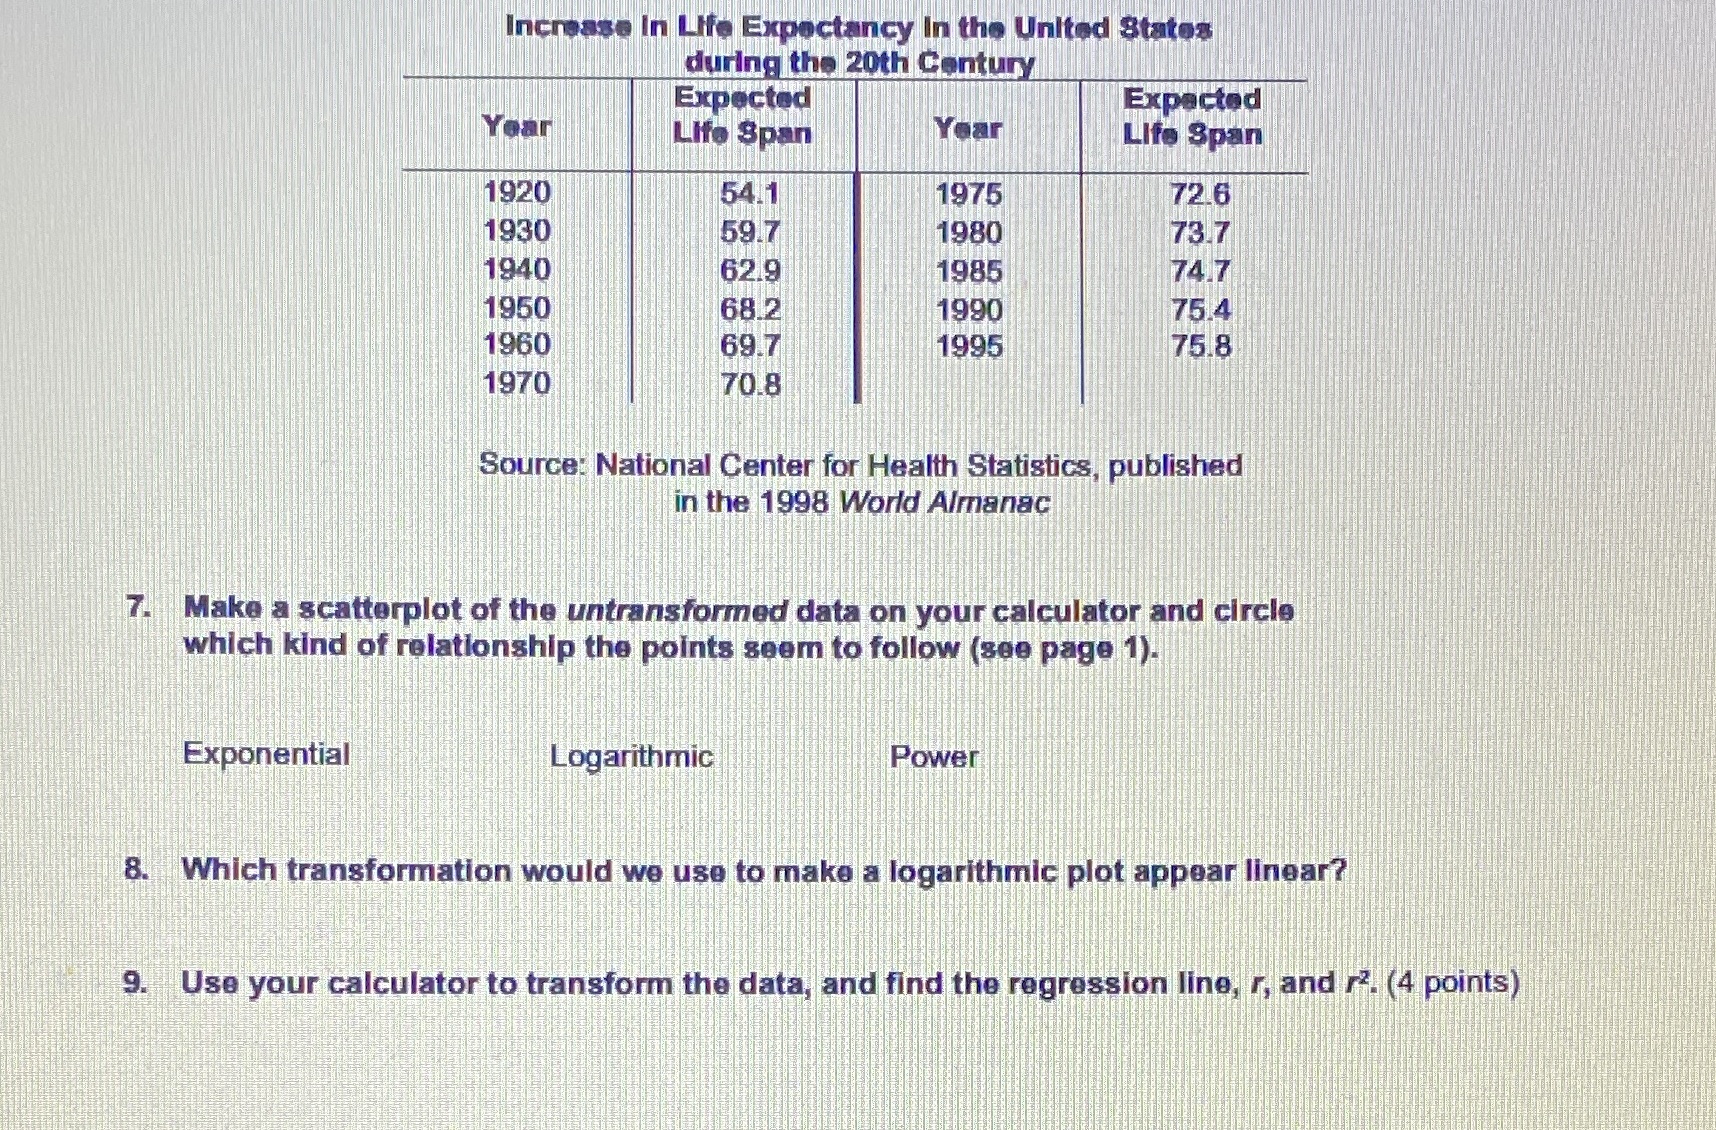
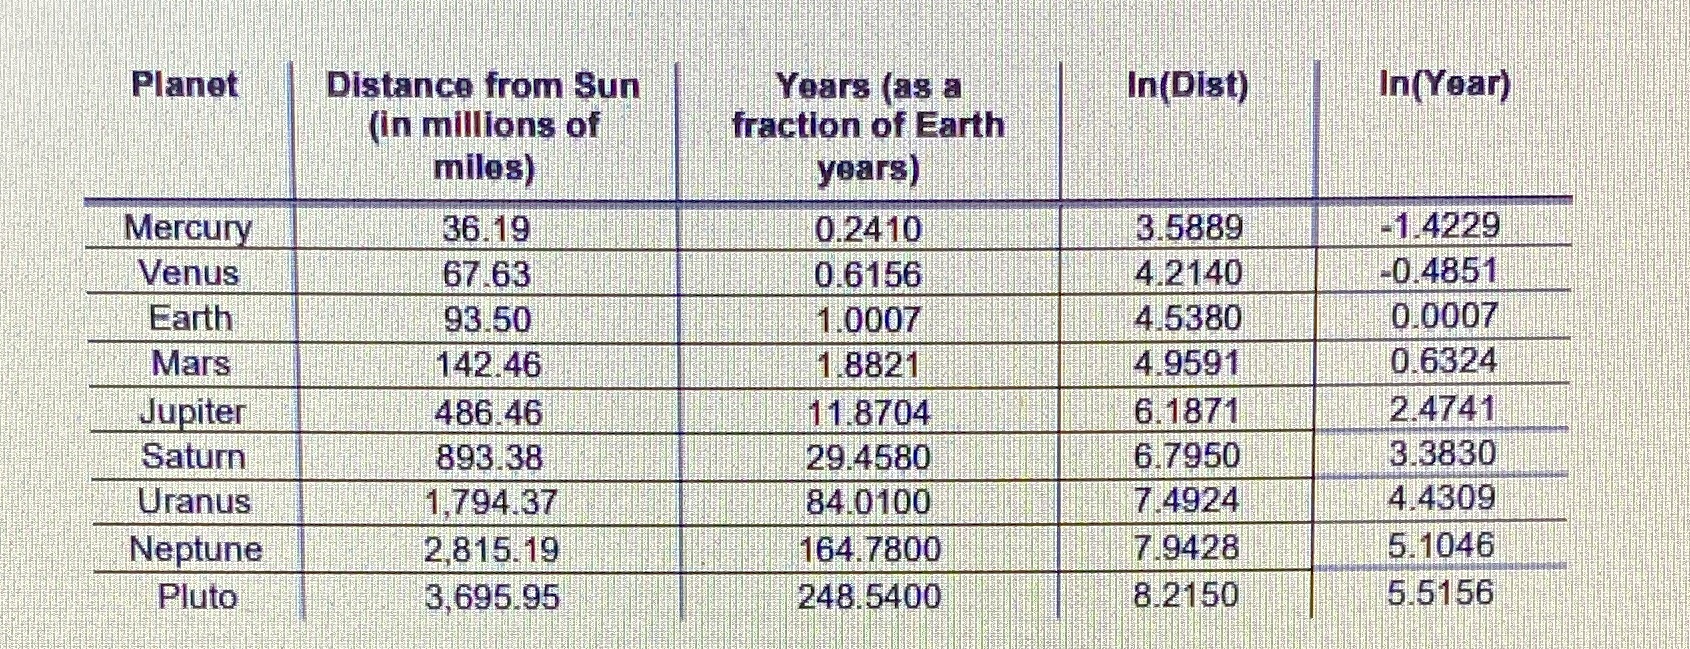
Increase In Life Expectancy In the United States during the 20th Century Expected Expected Year Life Span Year Life Span 1920 54.1 1975 72.6 1930 59.7 1980 73.7 1940 62.9 1985 74.7 1950 68.2 1990 75.4 1960 69.7 1995 75.8 1970 70.8 Source: National Center for Health Statistics, published in the 1998 World Almanac 7. Make a scatterplot of the untransformed data on your calculator and circle which kind of relationship the points seem to follow (see page 1). Exponential Logarithmic Power 8. Which transformation would we use to make a logarithmic plot appear linear? 9. Use your calculator to transform the data, and find the regression line, r, and /?. (4 points)Planet Distance from Sun Years (as a In (Dist) In(Year) (in millions of fraction of Earth miles) years) Mercury 36.19 0.2410 3.5889 -1.4229 Venus 67.63 0.6156 4.2140 0.4851 Earth 93.50 1.0007 4 5380 0.0007 Mars 142.46 1.8821 4.9591 0.6324 Jupiter 486.46 11.8704 6.1871 2.4741 Saturn 893.38 29.4580 6.7950 3.3830 Uranus 1.794.37 84.0100 7.4924 4.4309 Neptune 2,815.19 164.7800 7.9428 5.1046 Pluto 3,695.95 248.5400 8.2150 5.5156
Step by Step Solution
There are 3 Steps involved in it

Get step-by-step solutions from verified subject matter experts