

Question: Please help, thanks. (6) Table Q4 summarise the suspended solid removal percentage in a flocculating suspension system with initial solid concentration of 200 mg/L. 0
Please help, thanks.
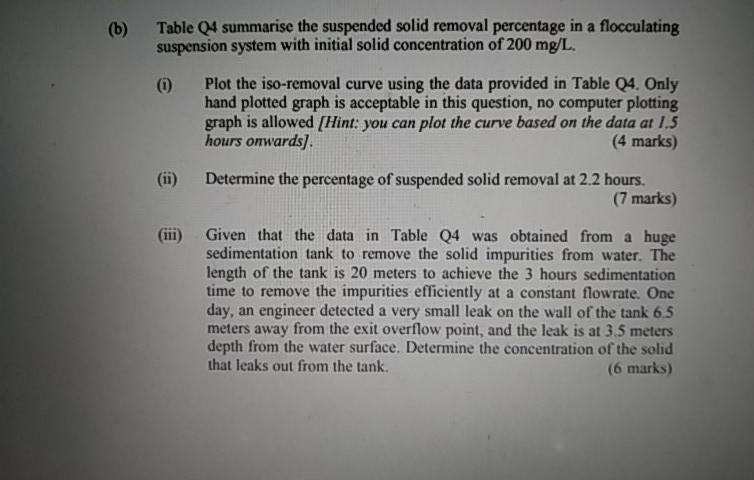
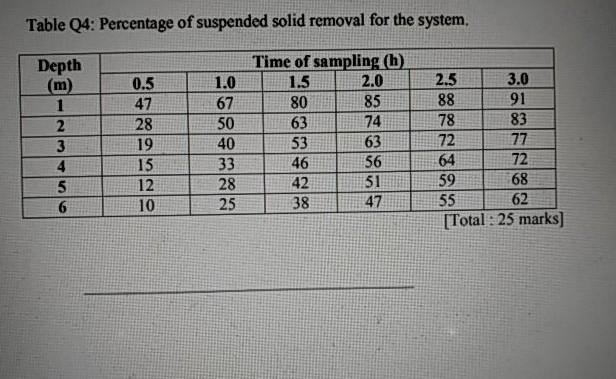
(6) Table Q4 summarise the suspended solid removal percentage in a flocculating suspension system with initial solid concentration of 200 mg/L. 0 Plot the iso-removal curve using the data provided in Table Q4. Only hand plotted graph is acceptable in this question, no computer plotting graph is allowed (Hint: you can plot the curve based on the data at 1.5 hours onwards) (4 marks) Determine the percentage of suspended solid removal at 2.2 hours. (7 marks) (iii) Given that the data in Table Q4 was obtained from a huge sedimentation tank to remove the solid impurities from water. The length of the tank is 20 meters to achieve the 3 hours sedimentation time to remove the impurities efficiently at a constant flowrate. One day, an engineer detected a very small leak on the wall of the tank 6.5 meters away from the exit overflow point, and the leak is at 3.5 meters depth from the water surface. Determine the concentration of the solid that leaks out from the tank. (6 marks) Table Q4: Percentage of suspended solid removal for the system, Depth 1 2 3 4 5 6 0.5 47 28 19 15 12 10 1.0 67 50 40 33 28 25 Time of sampling (h) 1.5 2.0 80 85 63 74 53 63 46 56 42 51 38 47 2.5 3.0 88 91 78 83 72 77 64 72 59 68 55 62 [Total : 25 marks]Step by Step Solution
There are 3 Steps involved in it
1 Expert Approved Answer
Step: 1 Unlock

Question Has Been Solved by an Expert!
Get step-by-step solutions from verified subject matter experts
Step: 2 Unlock
Step: 3 Unlock