

Question: Please help The consumption function is one of the key relationships in economics, where consumption is a function of disposable income. The accompanying table shows
Please help
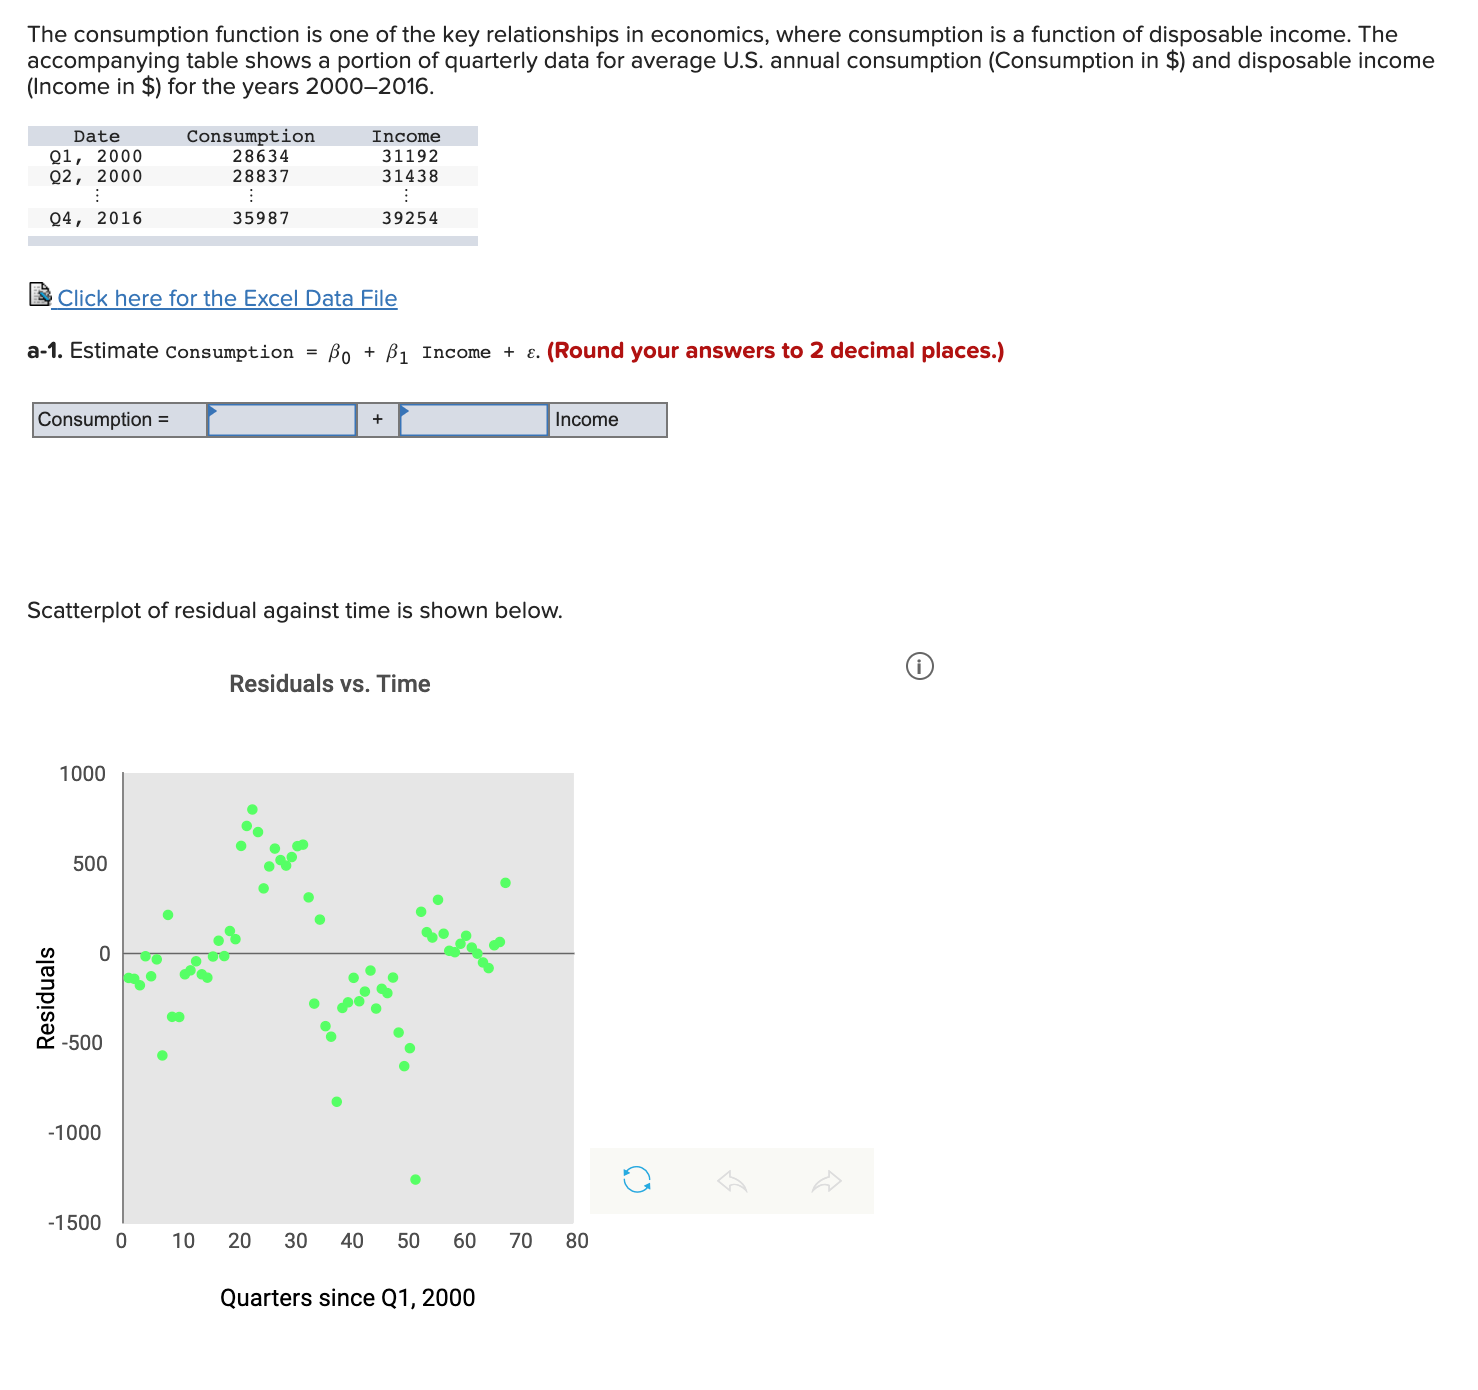
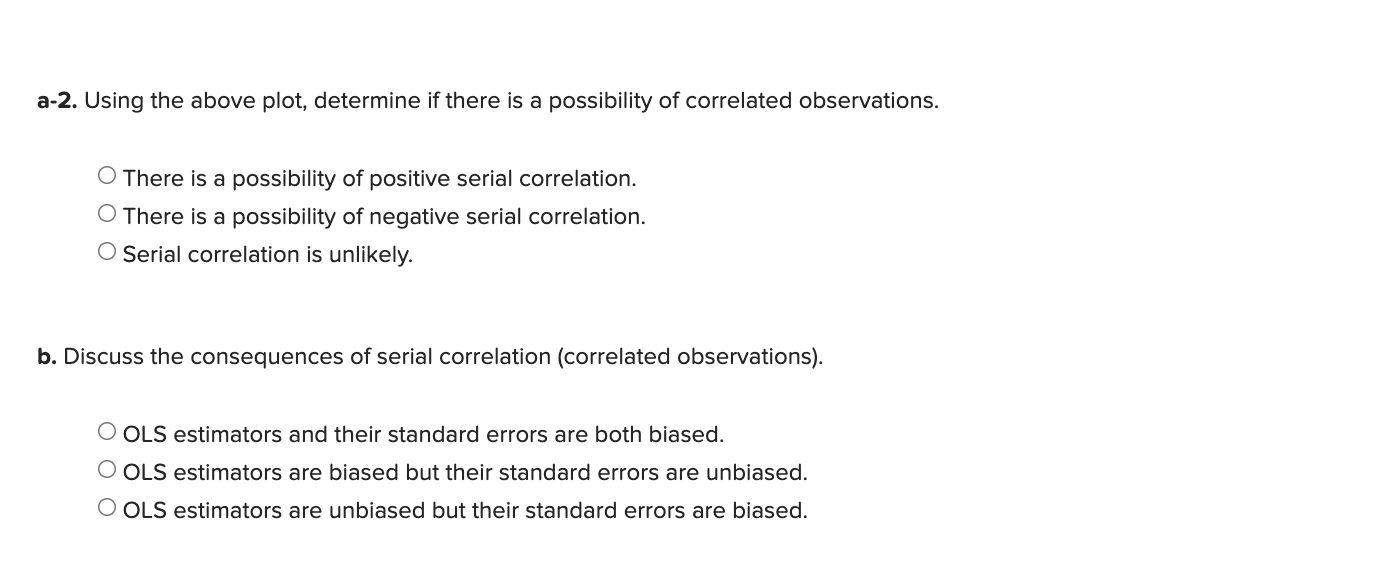
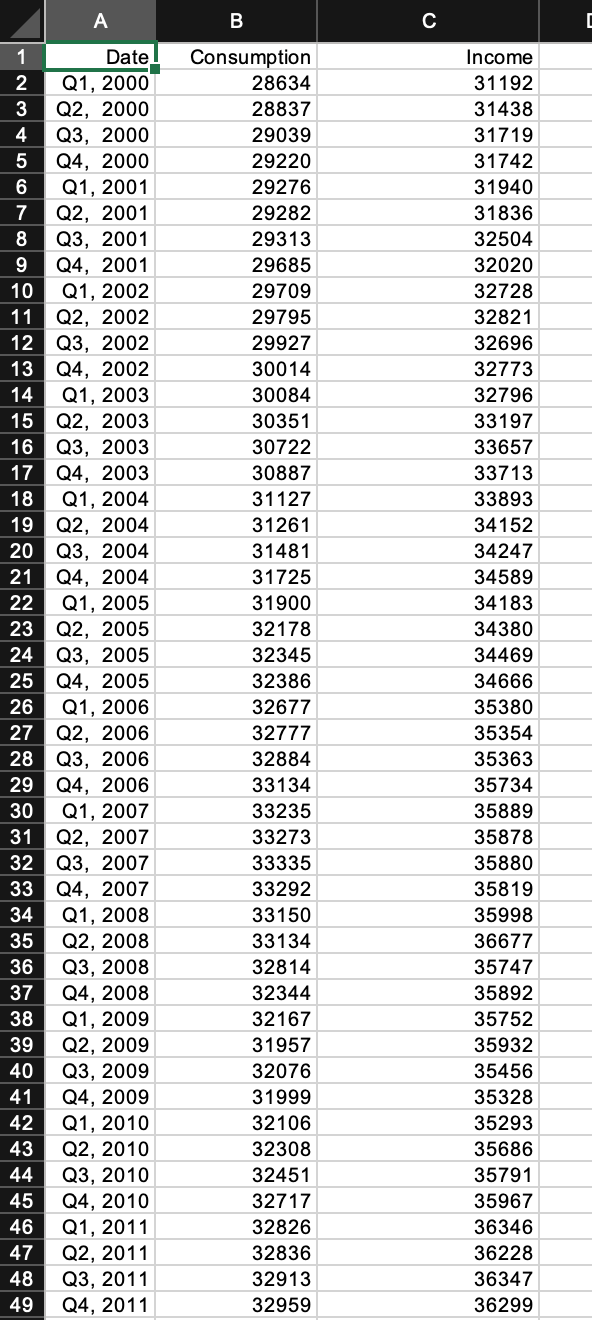
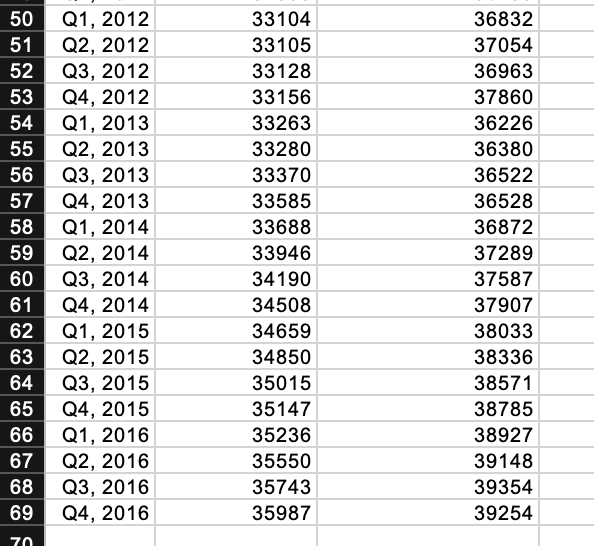
The consumption function is one of the key relationships in economics, where consumption is a function of disposable income. The accompanying table shows a portion of quarterly data for average US. annual consumption (Consumption in $) and disposable income (Income in 3;) for the years 20002016. Date Consumption Income Q1, 2000 28634 31192 92, _2000 2083'! 31533 Q4, 2016 35937 39254 Click here for the Excel Data File a-1. Estimate Consumption = ,80 + ,31 Income + a. [Round your answers to 2 decimal places.) consumpon= _l__ Scatterplot of residual against time is shown below. Residuals vs. Time 1000 500 Residuals -1 000 O 4500' 0 10 20 3D 40 50 60 70 80 Quarters since 01, 2000 8-2. Using the above plot, determine ifthere is a possibility of correlated observations. 0 There is a possibility of positive serial correlation. 0 There is a possibility of negative serial correlation. 0 Serial correlation is unlikely. b. Discuss the consequences of serial correlation (correlated observations). 0 OLS estimators and their standard errors are both biased. O OLS estimators are biased but their standard errors are unbiased. O OLS estimators are unbiased but their standard errors are biased. A B C Date_ Consumption Income 2 Q1, 2000 28634 31192 3 Q2, 2000 28837 31438 4 Q3, 2000 29039 31719 5 Q4, 2000 29220 31742 6 Q1, 2001 29276 31940 7 Q2, 2001 29282 31836 8 Q3, 2001 29313 32504 9 Q4, 2001 29685 32020 10 Q1, 2002 29709 32728 11 Q2, 2002 29795 32821 12 Q3, 2002 29927 32696 13 Q4, 2002 30014 32773 14 Q1, 2003 30084 32796 15 Q2, 2003 30351 33197 16 Q3, 2003 30722 33657 17 Q4, 2003 30887 33713 18 Q1, 2004 31127 33893 19 Q2, 2004 31261 34152 20 Q3, 2004 31481 34247 21 Q4, 2004 31725 34589 22 Q1, 2005 31900 34183 23 Q2, 2005 32178 34380 24 Q3, 2005 32345 34469 25 Q4, 2005 32386 34666 26 Q1, 2006 32677 35380 27 Q2, 2006 32777 35354 28 Q3, 2006 32884 35363 29 Q4, 2006 33134 35734 30 Q1, 2007 33235 35889 31 Q2, 2007 33273 35878 32 Q3, 2007 33335 35880 33 Q4, 2007 33292 35819 34 Q1, 2008 33150 35998 35 Q2, 2008 33134 36677 36 Q3, 2008 32814 35747 37 Q4, 2008 32344 35892 38 Q1, 2009 32167 35752 39 Q2, 2009 31957 35932 40 Q3, 2009 32076 35456 41 Q4, 2009 31999 35328 42 Q1, 2010 32106 35293 43 Q2, 2010 32308 35686 44 Q3, 2010 32451 35791 45 Q4, 2010 32717 35967 46 Q1, 2011 32826 36346 47 Q2, 2011 32836 36228 48 Q3, 2011 32913 36347 49 Q4, 2011 32959 3629950 Q1, 2012 33104 36832 51 Q2, 2012 33105 37054 52 Q3, 2012 33128 36963 53 Q4, 2012 33156 37860 54 Q1, 2013 33263 36226 55 Q2, 2013 33280 36380 56 Q3, 2013 33370 36522 57 Q4, 2013 33585 36528 58 Q1, 2014 33688 36872 59 Q2, 2014 33946 37289 60 Q3, 2014 34190 37587 61 Q4, 2014 34508 37907 62 Q1, 2015 34659 38033 63 Q2, 2015 34850 38336 64 Q3, 2015 35015 38571 65 Q4, 2015 35147 38785 66 Q1, 2016 35236 38927 67 Q2, 2016 35550 39148 68 Q3, 2016 35743 39354 69 Q4, 2016 35987 39254
Step by Step Solution
There are 3 Steps involved in it

Get step-by-step solutions from verified subject matter experts