

Question: Please help! The data in the table below show the total output (a mixture of consumer, capital, and government services) and prices of each product


Please help!
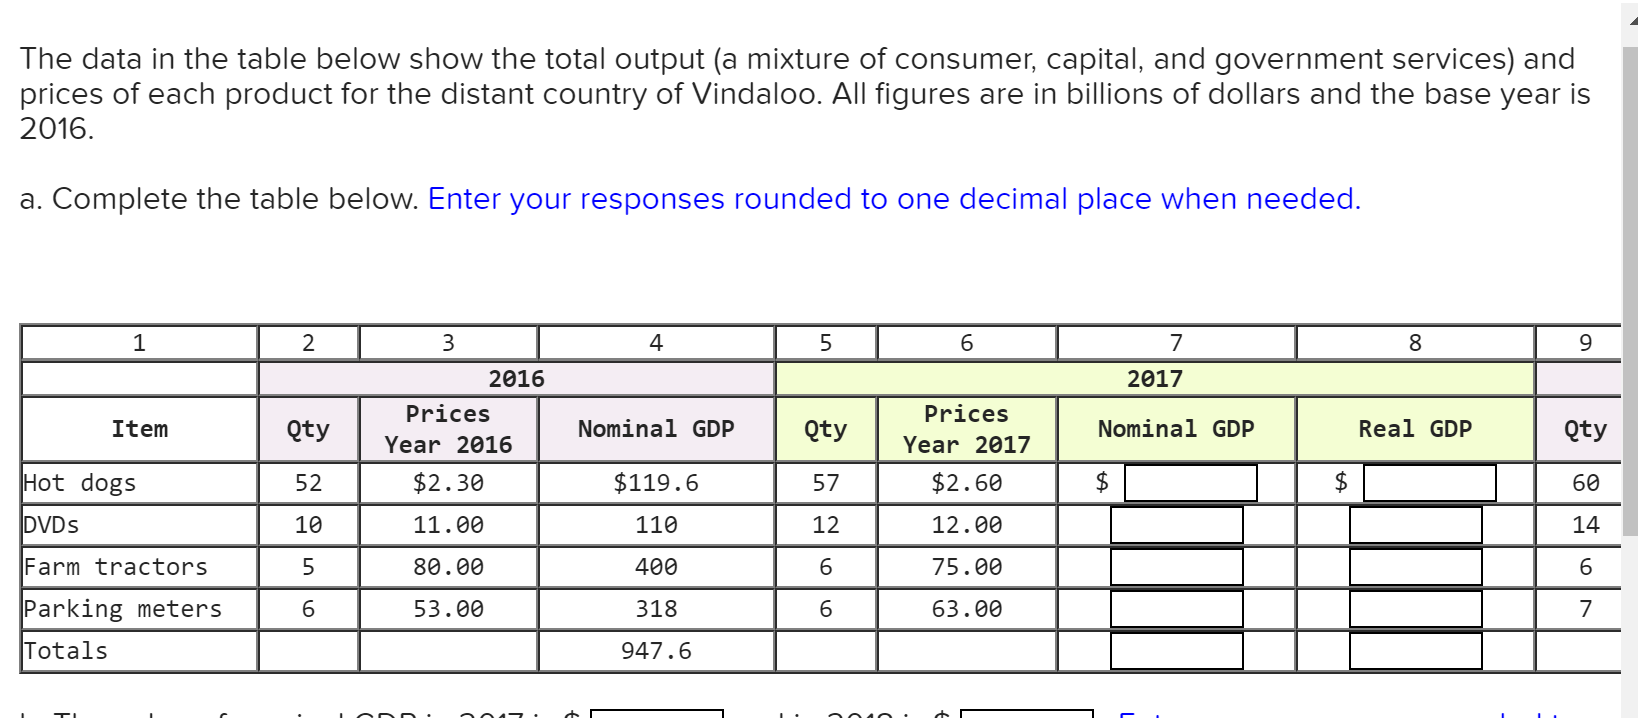
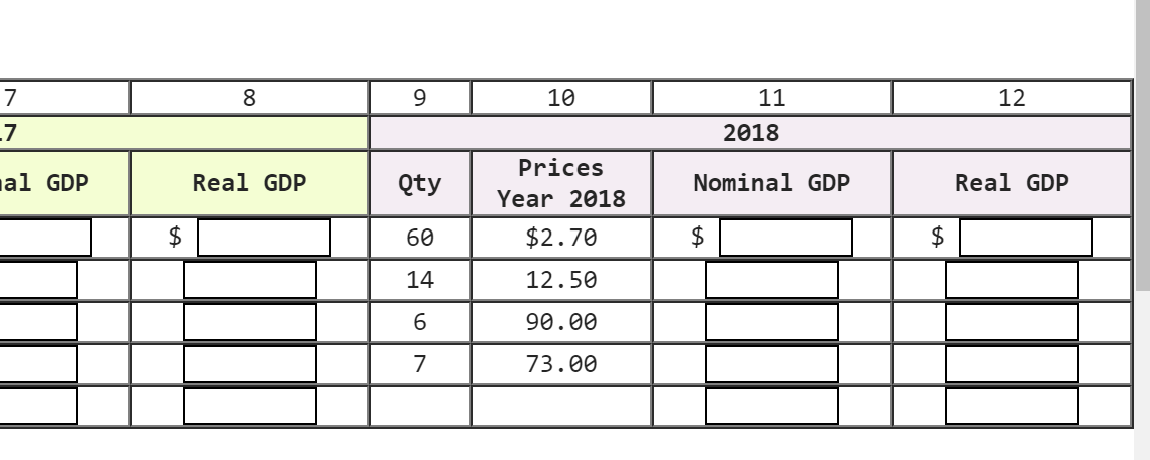
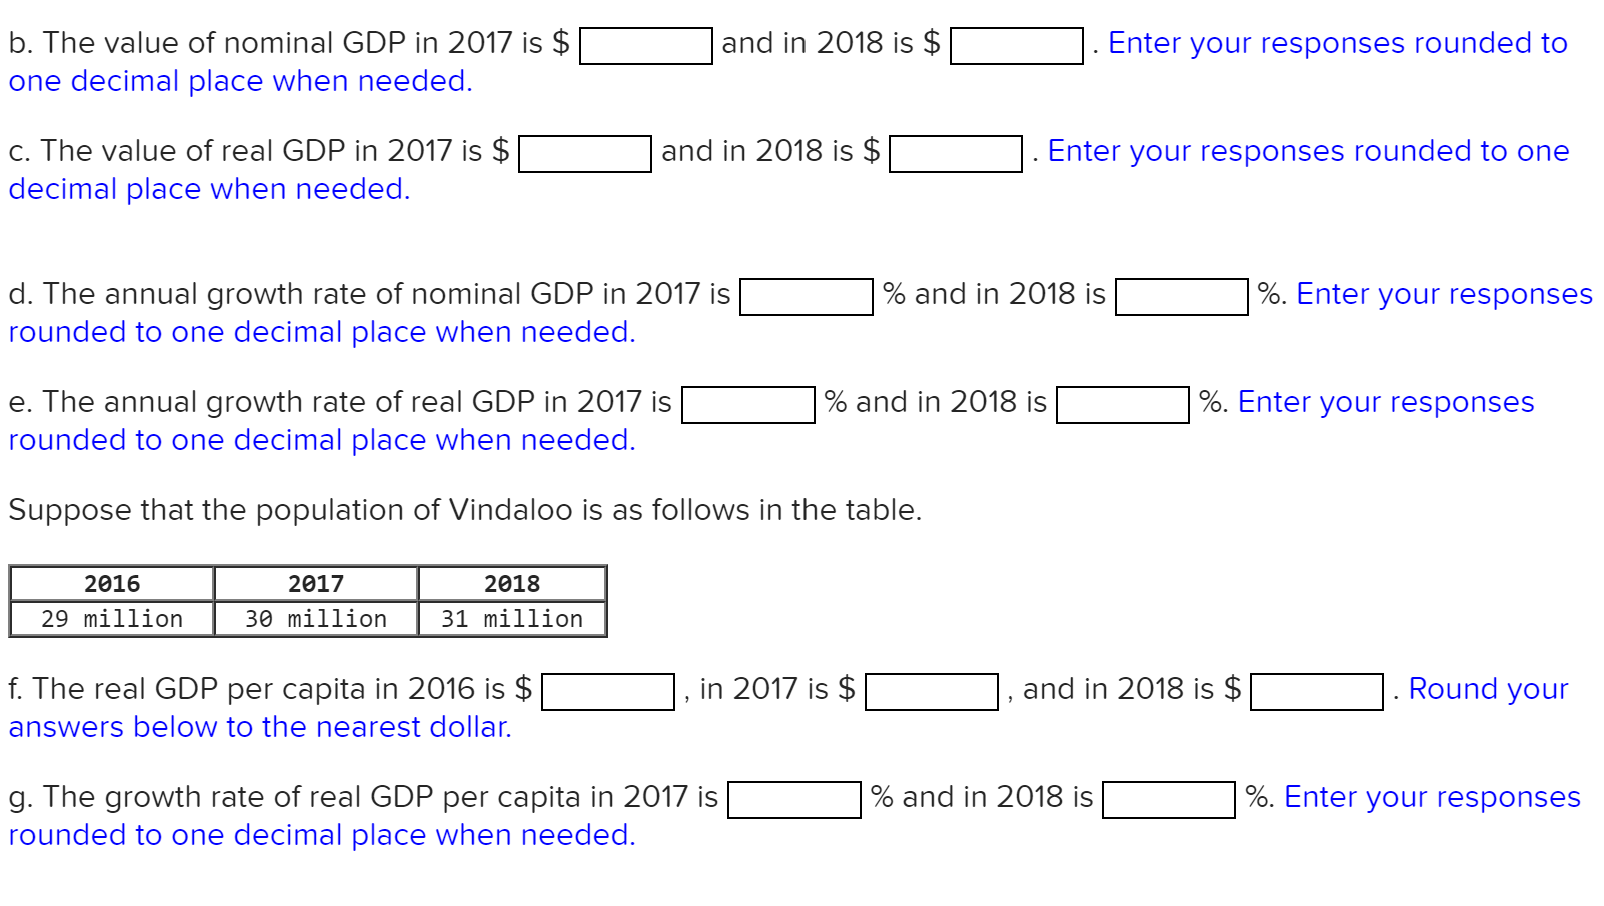
The data in the table below show the total output (a mixture of consumer, capital, and government services) and prices of each product for the distant country of Vindaloo. All figures are in billions of dollars and the base year is 2016. a. Complete the table below. Enter your responses rounded to one decimal place when needed. 1 2 3 4 5 6 7 8 9 2016 2017 Item Prices Qty Nominal GDP Prices Year 2016 Qty Year 2017 Nominal GDP Real GDP Qty Hot dogs 52 $2. 30 $119.6 57 $2. 60 $ 60 DVDS 10 11.00 110 12 12.00 14 Farm tractors 5 80.00 400 6 75.00 6 Parking meters 6 53.00 318 6 63.00 7 Totals 947 . 6\fb. The value of nominal GDP in 2017 is $ |:| and in 2018 is $ |:|. Enter your responses rounded to one decimal place when needed. C. The value of real GDP in 2017 is $ |:| and in 2018 is $ |:| . Enter your responses rounded to one decimal place when needed. d. The annual growth rate of nominal GDP in 2017 is |:| % and in 2018 is |:| %. Enter your responses rounded to one decimal place when needed. e. The annual growth rate of real GDP in 2017 is |:| % and in 2018 is |:| %. Enter your responses rounded to one decimal place when needed. Suppose that the population of Vindaloo is as follows in the table. \" 2017 2018 29 million 36 million 31 million f. The real GDP per capita in 2016 is $ |:| in 2017 is $ |:|, and in 2018 is $ |:|. Round your answers below to the nearest dollar. g. The growth rate of real GDP per capita in 2017 is |:| % and in 2018 is |:| %. Enter your responses rounded to one decimal place when needed
Step by Step Solution
There are 3 Steps involved in it

Get step-by-step solutions from verified subject matter experts