

Question: please help The following data sets represent simple random samples from a population (a) Compute the sample mean Of each data set. whose mean is
please help
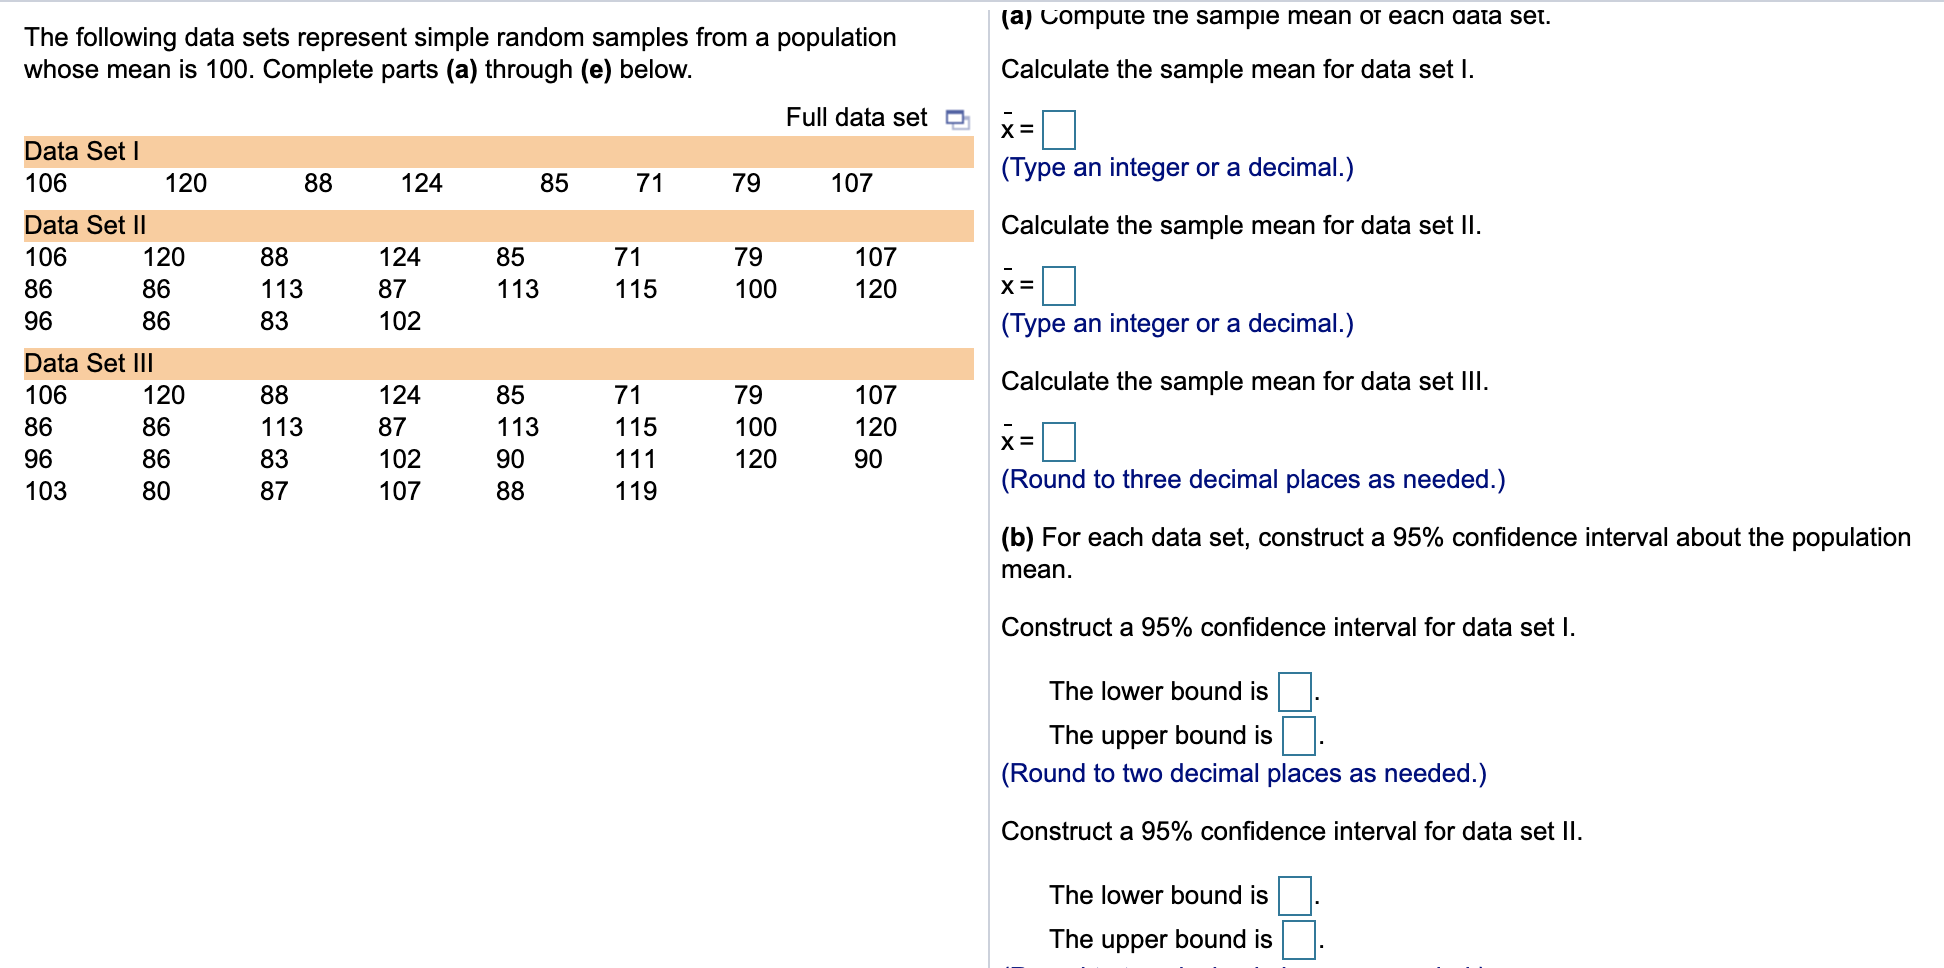
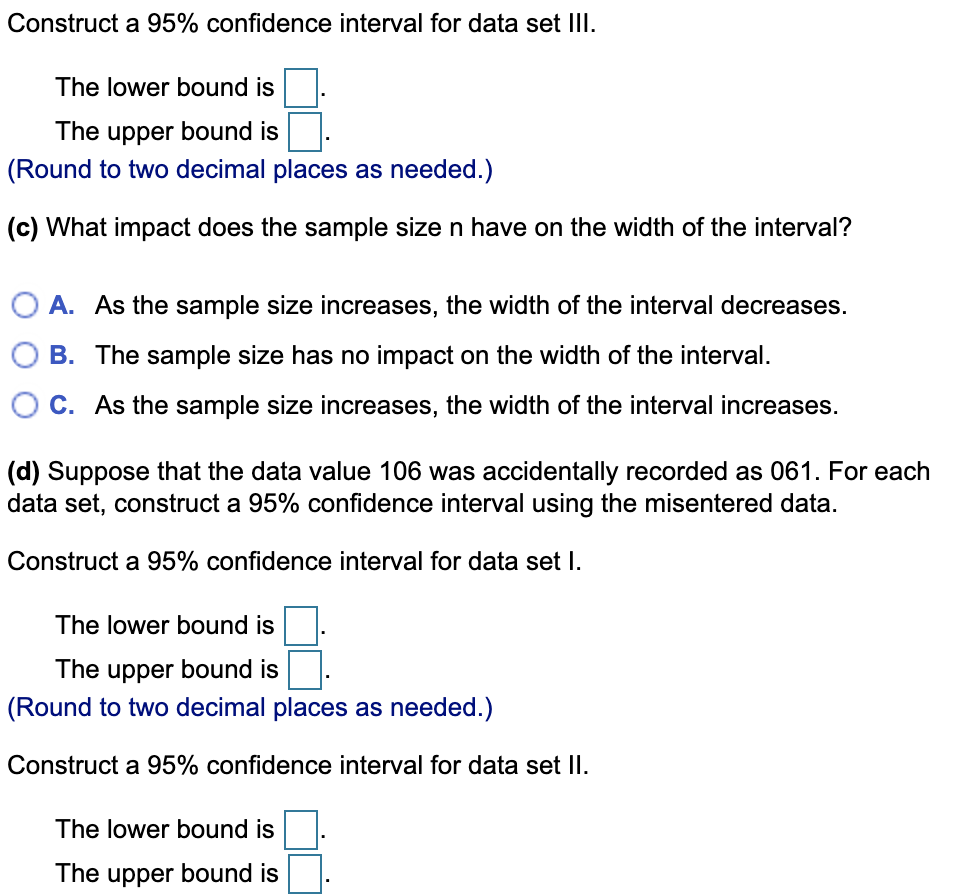
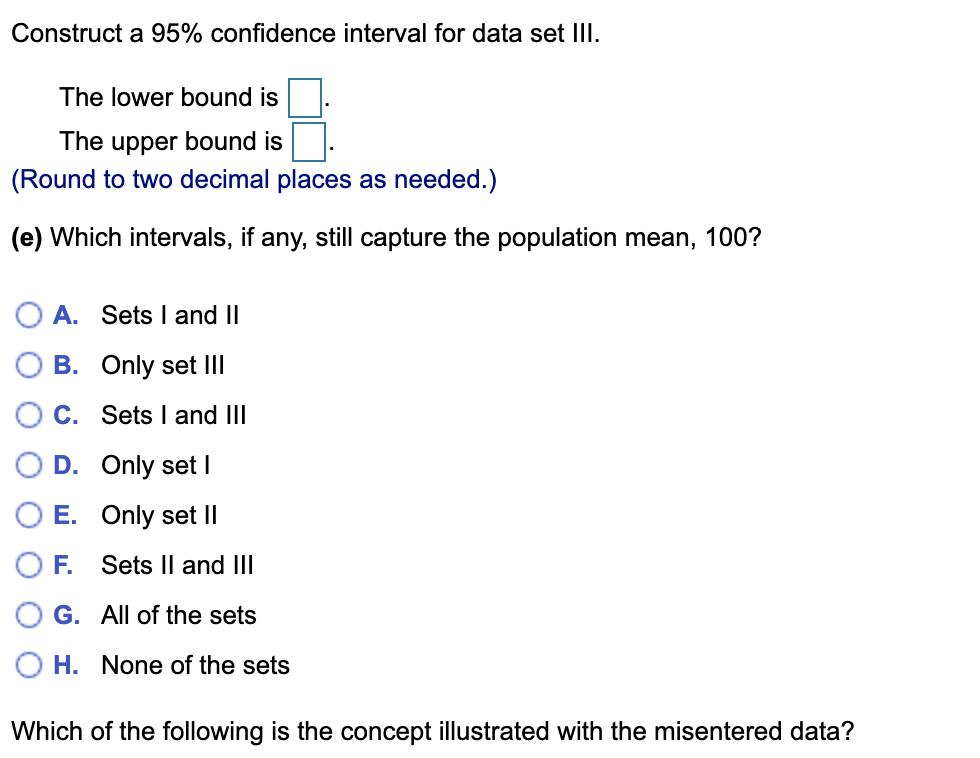
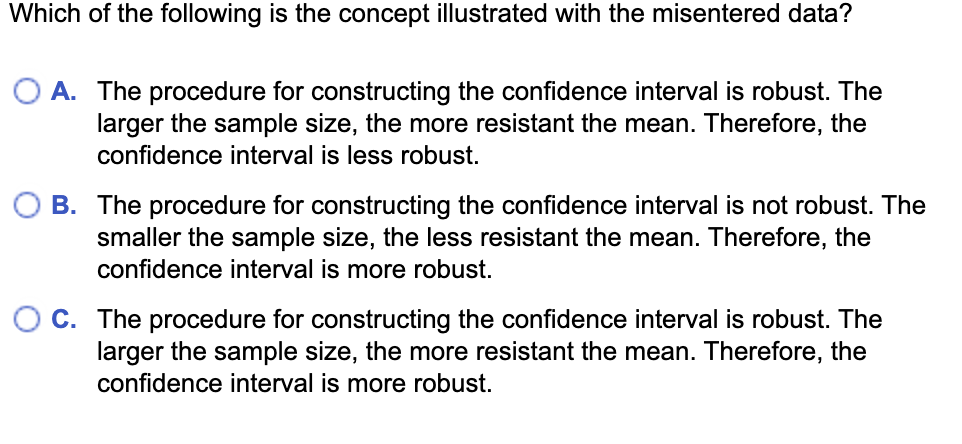
The following data sets represent simple random samples from a population (a) Compute the sample mean Of each data set. whose mean is 100. Complete parts (a) through (e) below. Calculate the sample mean for data set I. Full data set Data Set I X = 106 120 88 124 85 71 79 107 (Type an integer or a decimal.) Data Set II 106 120 88 124 85 71 Calculate the sample mean for data set II. 79 107 86 86 113 87 113 115 96 100 120 X = 86 83 102 Data Set Ill (Type an integer or a decimal.) 106 120 88 124 85 71 79 107 Calculate the sample mean for data set III. 86 86 113 87 113 115 100 120 96 86 83 102 90 111 120 90 X = 103 80 87 107 88 119 (Round to three decimal places as needed.) (b) For each data set, construct a 95% confidence interval about the population mean. Construct a 95% confidence interval for data set I. The lower bound is The upper bound is (Round to two decimal places as needed.) Construct a 95% confidence interval for data set II. The lower bound is The upper bound isConstruct a 95% condence interval for data set Ill. The lower bound is D. The upper bound is D. (Round to two decimal places as needed.) (c) What impact does the sample size n have on the width of the interval? 0 A. As the sample size increases, the width of the interval decreases. O B. The sample size has no impact on the width of the interval. 0 0. As the sample size increases, the width of the interval increases. (d) Suppose that the data value 106 was accidentally recorded as 061. For each data set, construct a 95% condence interval using the misentered data. Construct a 95% condence interval for data set I. The lower bound is D. The upper bound is D. (Round to two decimal places as needed.) Construct a 95% condence interval for data set II. The lower bound is D. The upper bound is D. Construct a 95% confidence interval for data set III. The lower bound is The upper bound is (Round to two decimal places as needed.) (e) Which intervals, if any, still capture the population mean, 100? O A. Sets I and II O B. Only set Ill O C. Sets I and III O D. Only set I O E. Only set II OF. Sets ll and III O G. All of the sets O H. None of the sets Which of the following is the concept illustrated with the misentered data?Which of the following is the concept illustrated with the misentered data? O A. The procedure for constructing the confidence interval is robust. The larger the sample size, the more resistant the mean. Therefore, the confidence interval is less robust. O B. The procedure for constructing the confidence interval is not robust. The smaller the sample size, the less resistant the mean. Therefore, the confidence interval is more robust. O C. The procedure for constructing the confidence interval is robust. The larger the sample size, the more resistant the mean. Therefore, the confidence interval is more robust
Step by Step Solution
There are 3 Steps involved in it

Get step-by-step solutions from verified subject matter experts