

Question: Please help The following graph represents supply and demand in the market for tanning sessions. Suppose that the government imposes a $15 excise tax on
Please help
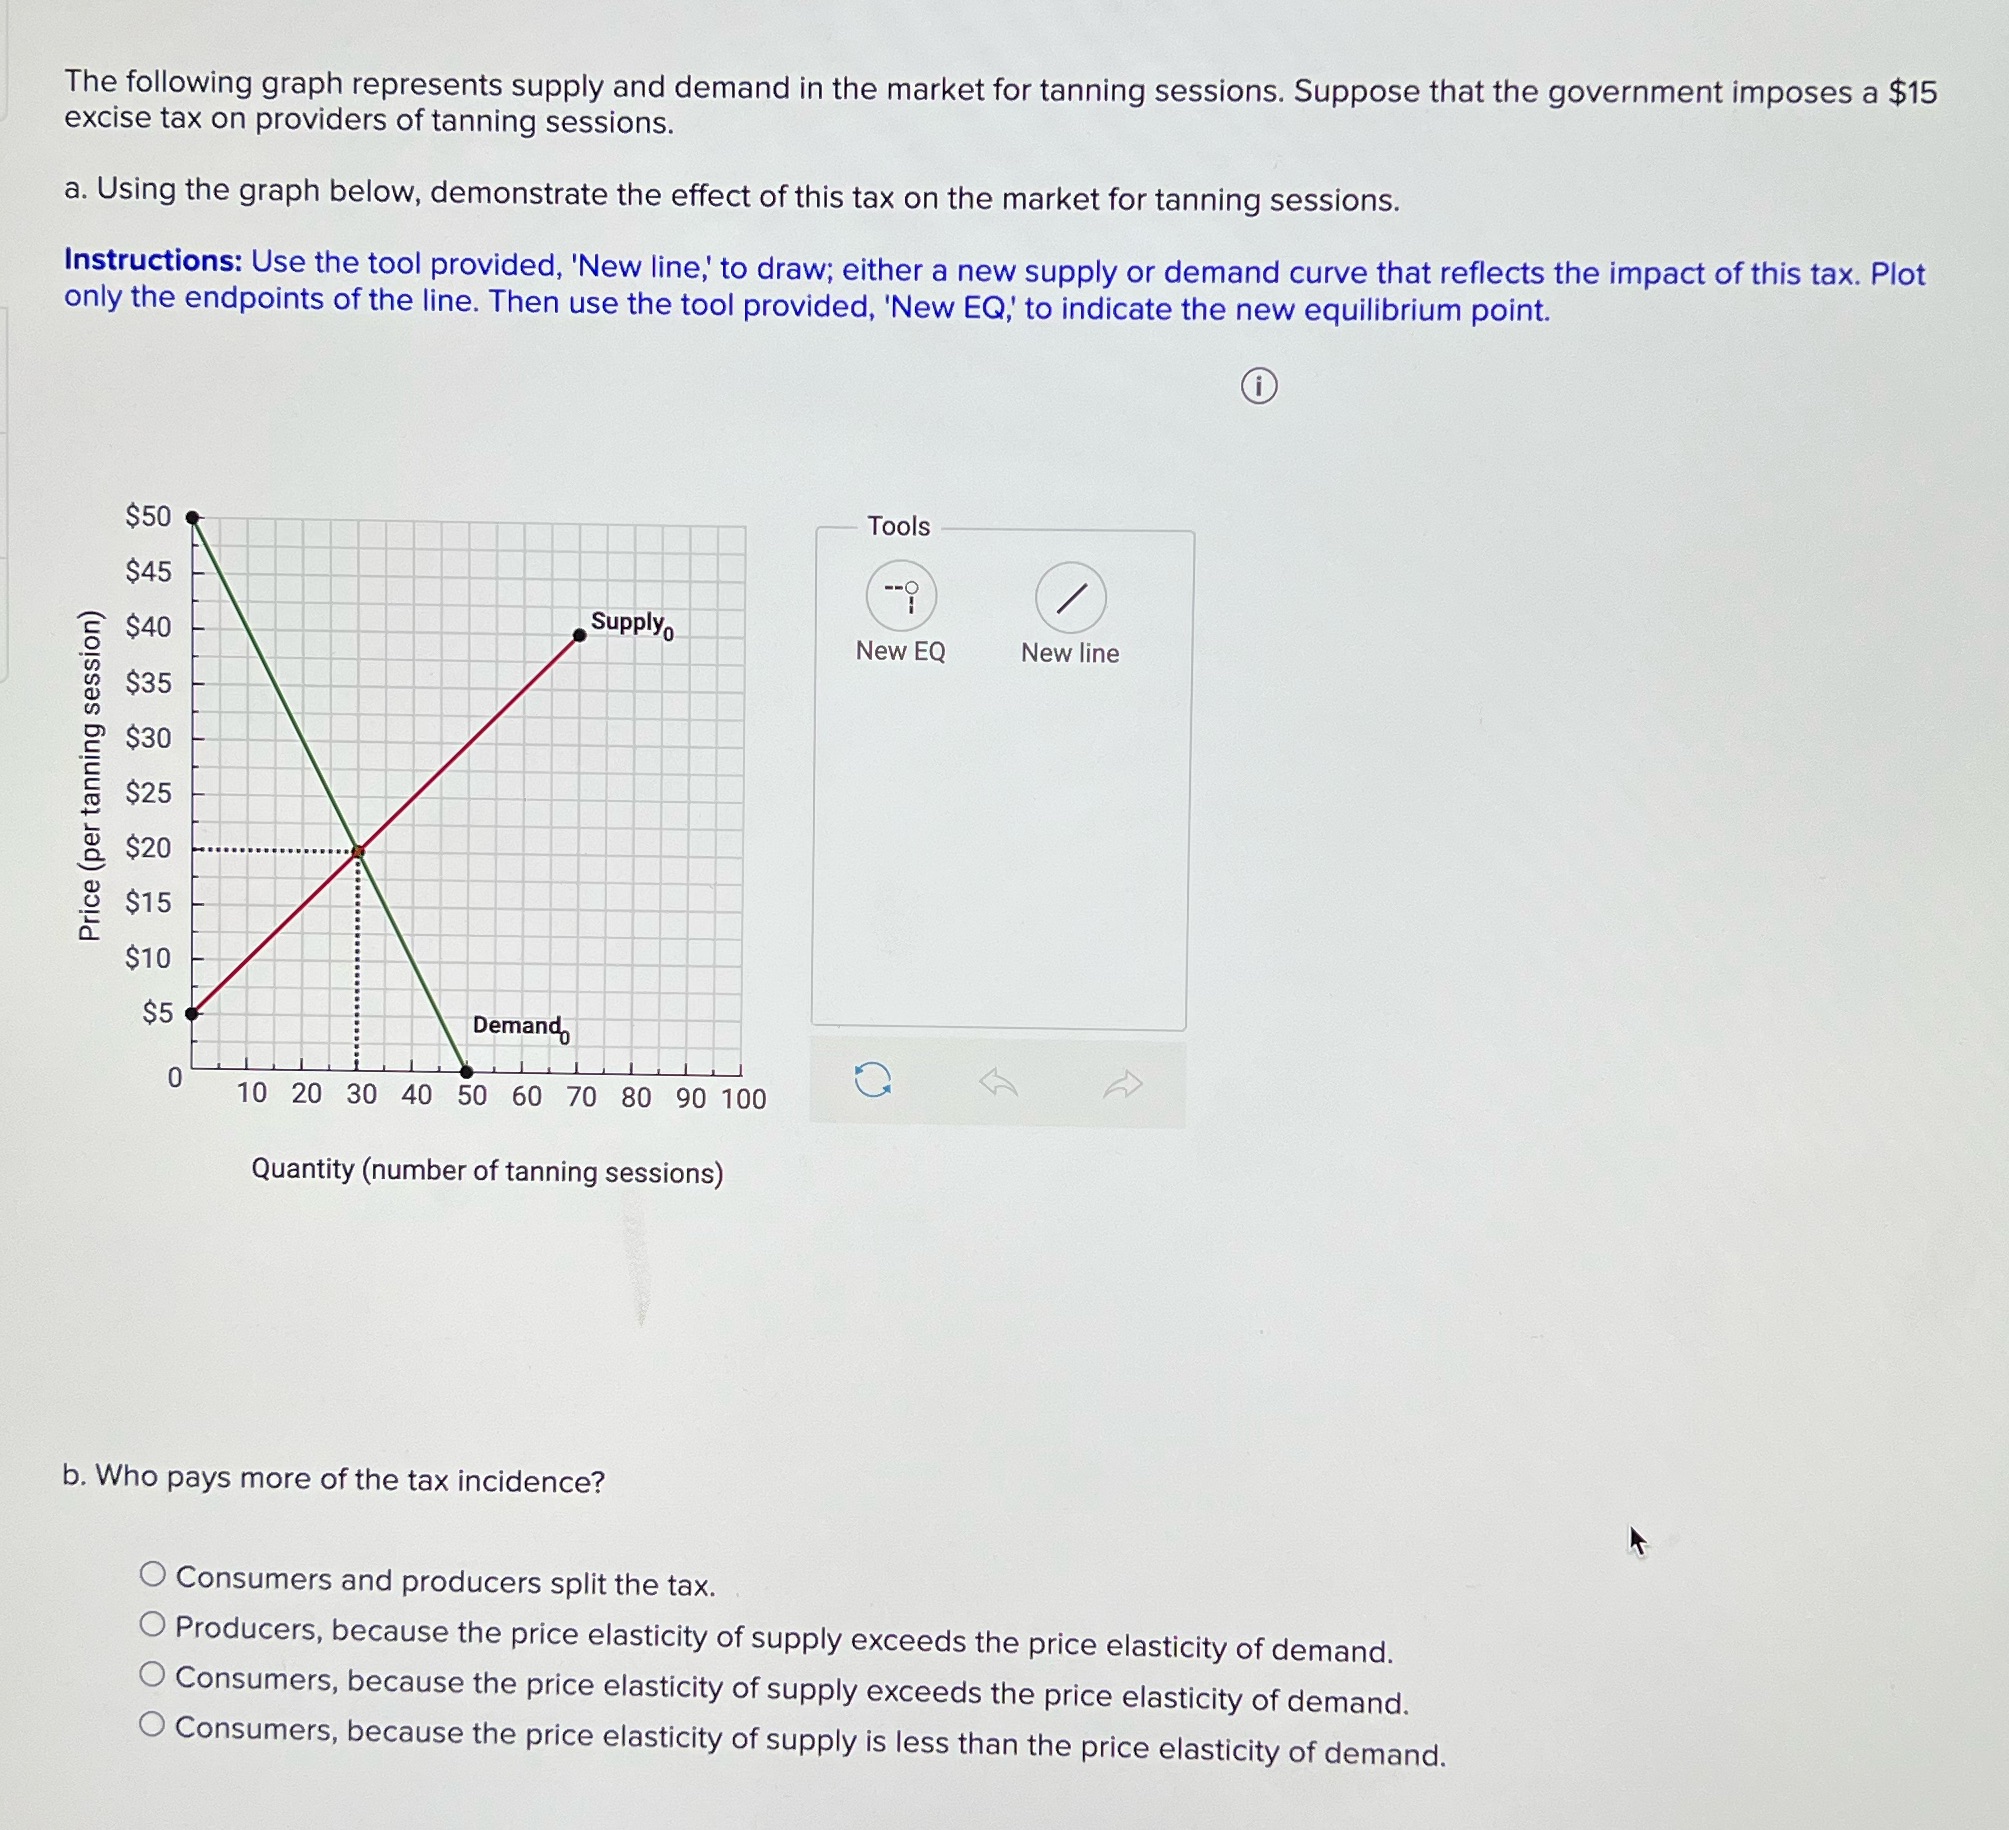
The following graph represents supply and demand in the market for tanning sessions. Suppose that the government imposes a $15 excise tax on providers of tanning sessions. a. Using the graph below, demonstrate the effect of this tax on the market for tanning sessions. Instructions: Use the tool provided, 'New line,' to draw; either a new supply or demand curve that reflects the impact of this tax. Plot only the endpoints of the line. Then use the tool provided, 'New EQ,' to indicate the new equilibrium point. $50 Tools $45 $40 Supply. New EQ New line $35 $30 Price (per tanning session) $25 $20 $15 $10 $5 Demand 0 10 20 30 40 50 60 70 80 90 100 Quantity (number of tanning sessions) b. Who pays more of the tax incidence? Consumers and producers split the tax. O Producers, because the price elasticity of supply exceeds the price elasticity of demand. . Consumers, because the price elasticity of supply exceeds the price elasticity of demand. Consumers, because the price elasticity of supply is less than the price elasticity of demand
Step by Step Solution
There are 3 Steps involved in it

Get step-by-step solutions from verified subject matter experts