

Question: please help The Income Statement and Balance Sheet for The Home Depot, Inc. can be found as separate worksheets on tabs (a) and (b), respectively.
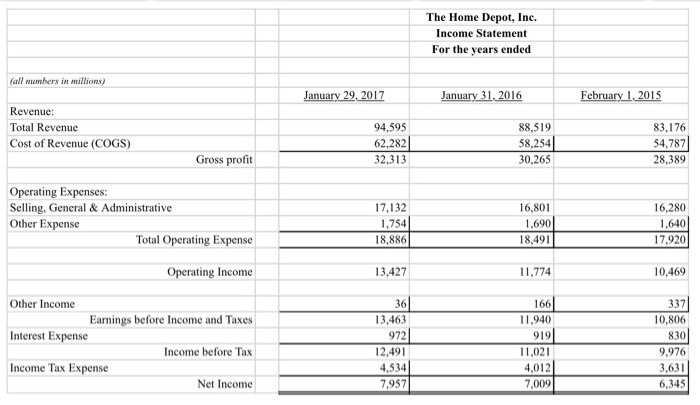
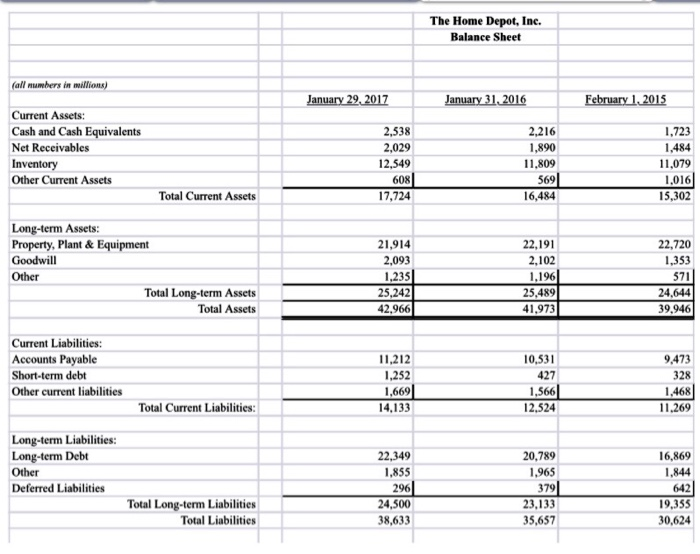
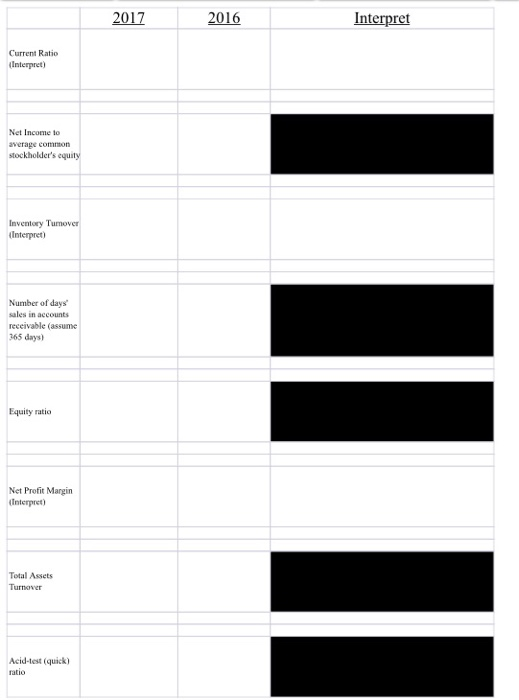
The Income Statement and Balance Sheet for The Home Depot, Inc. can be found as separate worksheets on tabs (a) and (b), respectively. On worksheet , prepare a ratio analysis for 2017 and 2016 that includes the following ratios: Current ratio Net income to average common stockholder's equity Inventory turnover Number of days' sales in accounts receivable (assume 365 days in a year) Equity ratio Profit Margin Total Assets turnover Acid-test (quick ratio) For three ratios (current ratio, inventory turnover, and profit margin) include your interpretation of the results of your analysis. Your interpretation should include what the ratio measures, whether it is increasing or decreasing, and whether the company should be concerned about the change in the ratio. The Home Depot, Inc. Income Statement For the years ended fall numbers in millions) January 29, 2017 January 31, 2016 February 1, 2015 Revenue: Total Revenue Cost of Revenue (COGS) 94,595 62,282 32,313 88,519 58,254 30,265 83,176 54,787 28,389 Gross profit Operating Expenses: Selling, General & Administrative Other Expense Total Operating Expense 17,132 1.754 18.886 16,801 1,690 18,491 16,280 1,640 17,920 Operating Income 13,427 11,774 10,469 Other Income Earnings before Income and Taxes Interest Expense Income before Tax Income Tax Expense Net Income 36 13,463 972 12,491 4.534 7,957 166 11,940 9191 11,021 4,012 7,009 337 10,806 830 9,976 3,631 6,345 The Home Depot, Inc. Balance Sheet January 29, 2017 January 31, 2016 February 1, 2015 (all numbers in millions) Current Assets: Cash and Cash Equivalents Net Receivables Inventory Other Current Assets 2,538 2,029 12,549 608 17,724 2,216 1,890 11.809 569 16,484 1.723 1,484 11,079 1,016 15,302 Total Current Assets Long-term Assets: Property, Plant & Equipment Goodwill Other Total Long-term Assets Total Assets 21,914 2,093 1,235 25.242 42,966 22,191 2.102 1.196 25,489 41,9731 22,720 1,353 571 24,644 39,946 Current Liabilities: Accounts Payable Short-term debt Other current liabilities 11,212 1,252 1,669 14,133 10,531 427 1,566 12.524 9.473 328 1,468 11.269 Total Current Liabilities: Long-term Liabilities: Long-term Debt Other Deferred Liabilities 22,349 1,855 296 24,500 38,633 20,789 1,965 379 23,133 35,657 16,869 1.844 642 19,335 30,624 Total Long-term Liabilities Total Liabilities 2017 2016 Interpret Current Ratio (Interpret) Net Income to average common stockholder's equity Inventory Tumover Interpret) Number of days sales in accounts receivable (assume 165 days Equity ratio Net Profit Margin (Interpret) Total Assets Turnover Acid-test (quick) ratio
Step by Step Solution
There are 3 Steps involved in it

Get step-by-step solutions from verified subject matter experts