

Question: please help The table to the right contains observed values and expected values in parentheses for two categorical variables, X and Y, where variable X
please help
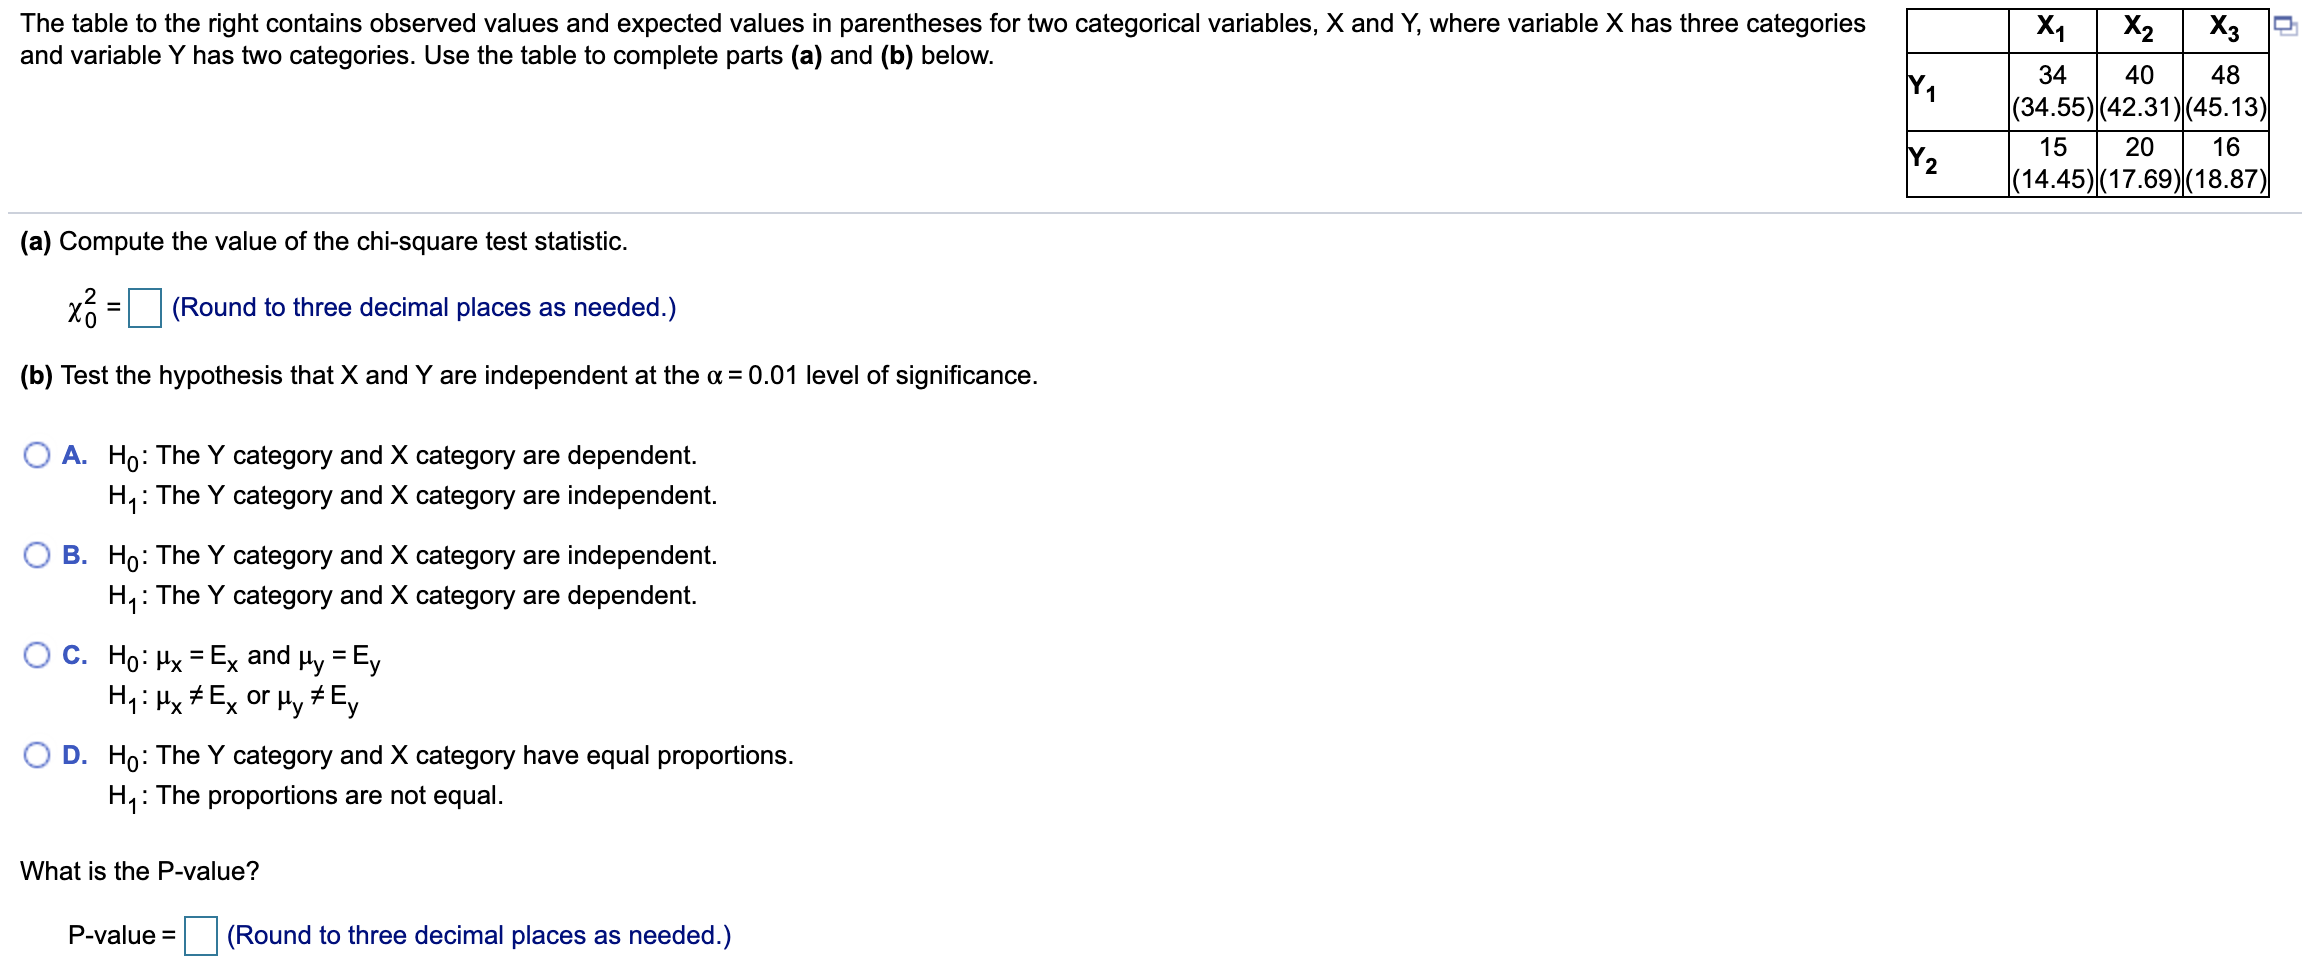
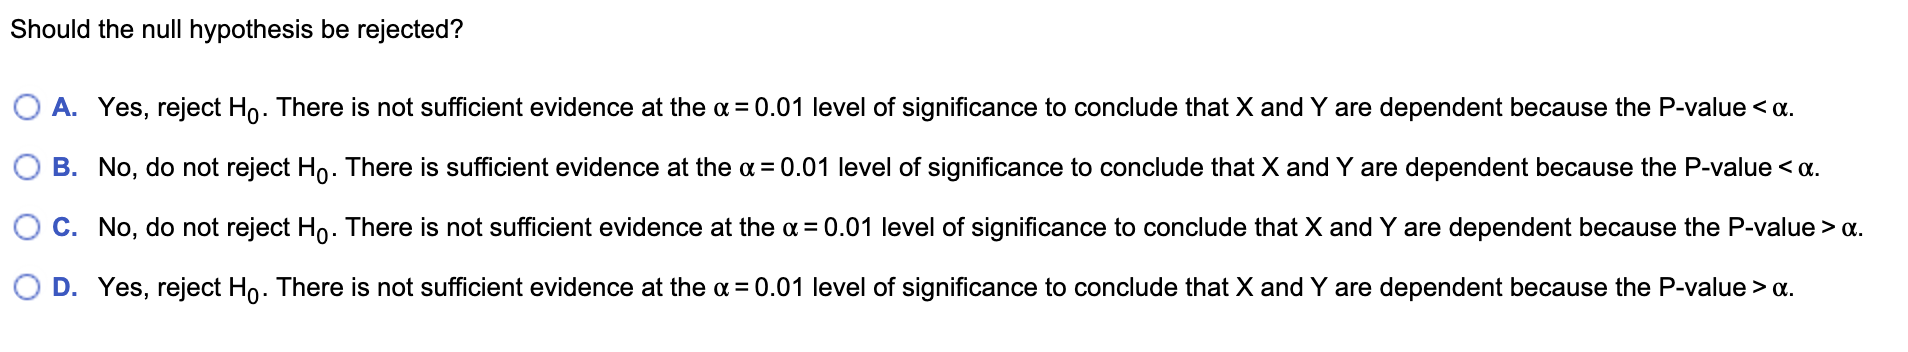
The table to the right contains observed values and expected values in parentheses for two categorical variables, X and Y, where variable X has three categories -\"\" X3 and variable Y has two categories. Use the table to complete parts (a) and (b) below. 34 40 48 .(3455) (42.31)(45.13) 15 20 16 (14.45) (17.69)(18.87) (a) Compute the value of the chi-square test statistic. xg = (Round to three decimal places as needed.) (b) Test the hypothesis that X and Y are independent at the or = 0.01 level of signicance. 0 A. Ho: The Y category and X category are dependent. H1: The Y category and X category are independent. 0 B. H0: The Y category and X category are independent. H1: The Y category and X category are dependent. O C. Hosz=Exandpy=Ey H12anEX orpyaEy O D. Ho: The Y category and X category have equal proportions. H1: The proportions are not equal. What is the P-value? Pvalue = E (Round to three decimal places as needed.) Should the null hypothesis be rejected? O A. Yes, reject Ho. There is not sufficient evidence at the a = 0.01 level of significance to conclude that X and Y are dependent because the P-value a. O D. Yes, reject Ho. There is not sufficient evidence at the a = 0.01 level of significance to conclude that X and Y are dependent because the P-value > a
Step by Step Solution
There are 3 Steps involved in it

Get step-by-step solutions from verified subject matter experts