

Question: The table to the right contains observed values and expected values in parentheses for two categorical variables, X and Y, where variable X has
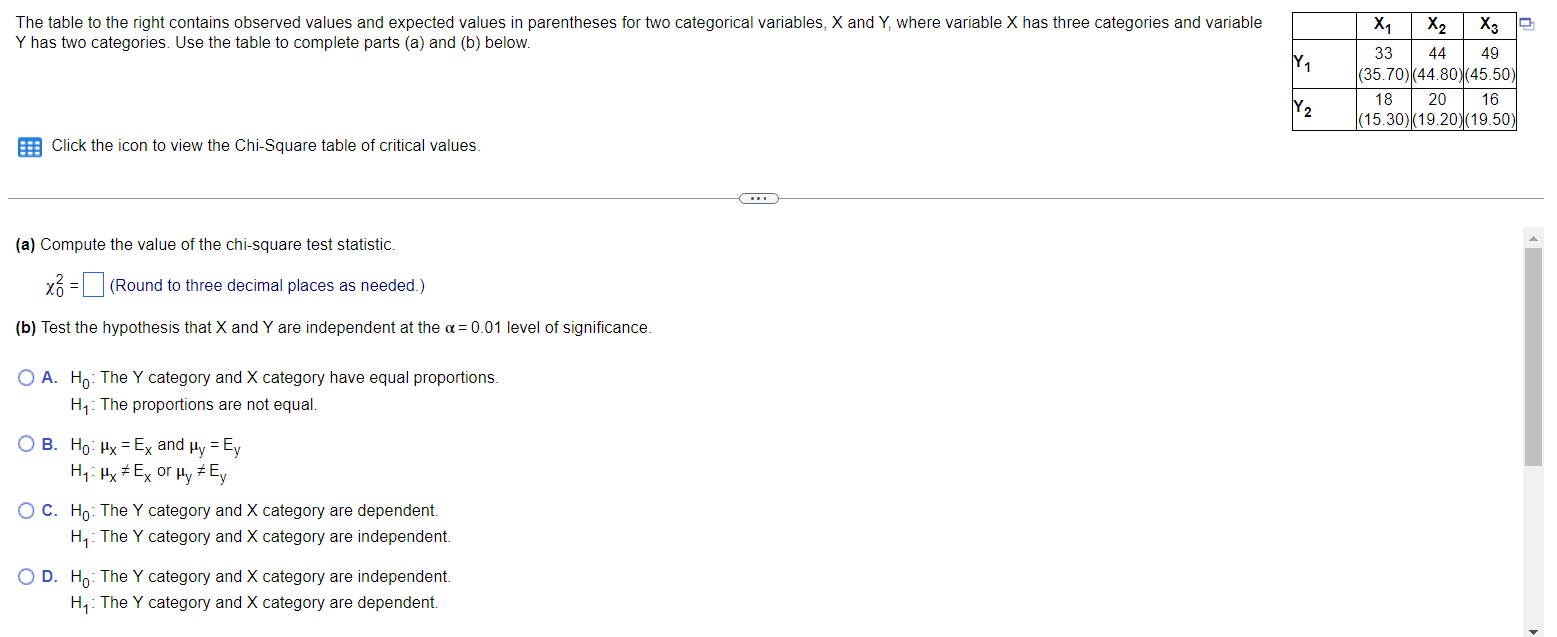
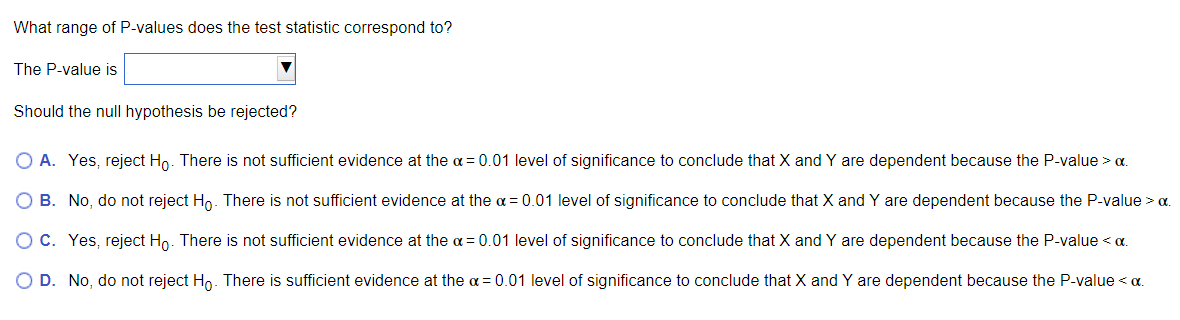
The table to the right contains observed values and expected values in parentheses for two categorical variables, X and Y, where variable X has three categories and variable Y has two categories. Use the table to complete parts (a) and (b) below. Click the icon to view the Chi-Square table of critical values. (a) Compute the value of the chi-square test statistic. (Round to three decimal places as needed.) (b) Test the hypothesis that X and Y are independent at the a = 0.01 level of significance. A. Ho: The Y category and X category have equal proportions. H: The proportions are not equal. OB. Ho Hx= = Ex and My = Ey H: HxEx or Hy Ey OC. Ho: The Y category and X category are dependent. H: The Y category and X category are independent. D. Ho: The Y category and X category are independent. H: The Y category and X category are dependent. X X2 X3 33 44 49 Y (35.70) (44.80)(45.50) 18 20 16 Y2 (15.30) (19.20) (19.50) What range of P-values does the test statistic correspond to? The P-value is Should the null hypothesis be rejected? A. Yes, reject Ho. There is not sufficient evidence at the a = 0.01 level of significance to conclude that X and Y are dependent because the P-value> . B. No, do not reject Ho. There is not sufficient evidence at the a = 0.01 level of significance to conclude that X and Y are dependent because the P-value> x. C. Yes, reject Ho. There is not sufficient evidence at the a = 0.01 level of significance to conclude that X and Y are dependent because the P-value
Step by Step Solution
There are 3 Steps involved in it

Get step-by-step solutions from verified subject matter experts