

Question: Please help to answer the following questions step by step, studying for a midterm. The data for a random sample of 10 paired observations are
Please help to answer the following questions step by step, studying for a midterm.
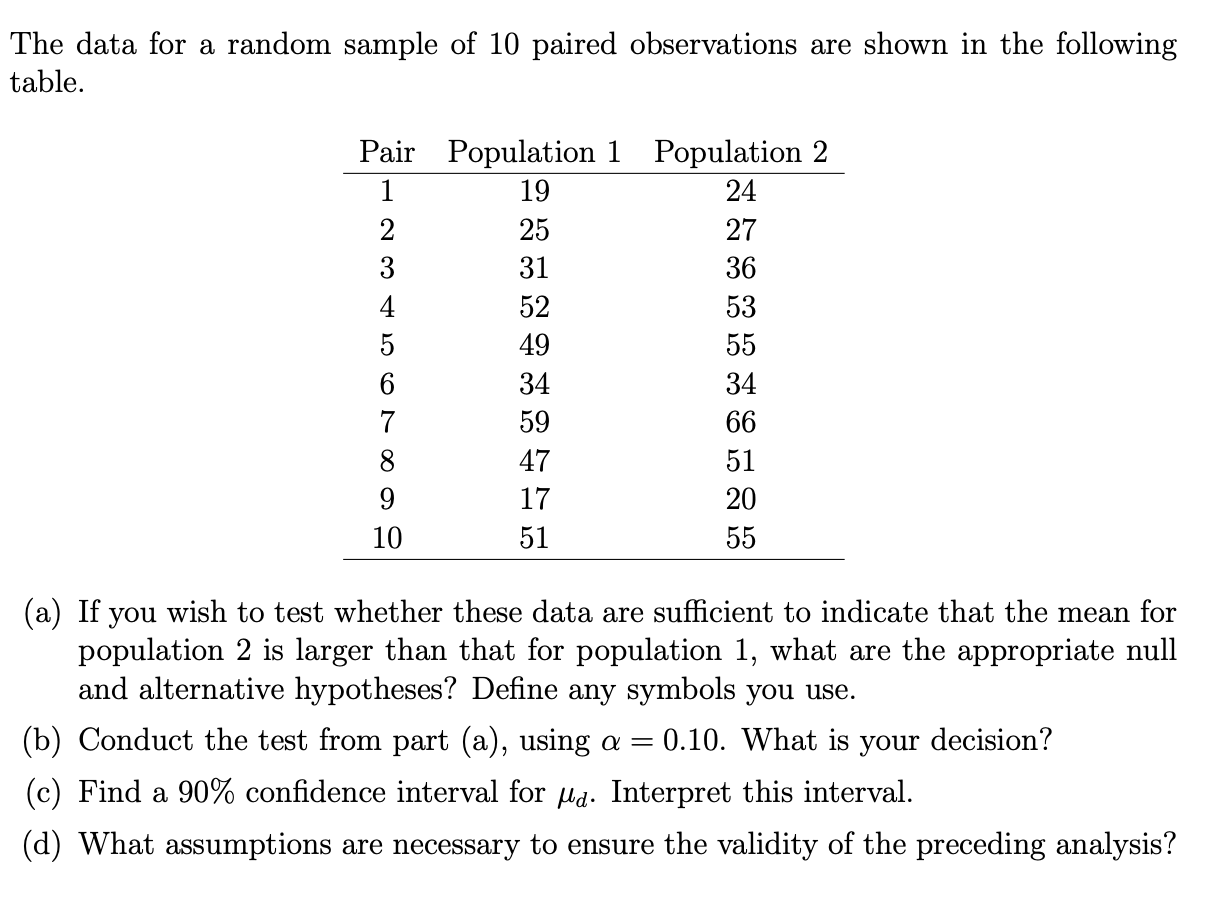
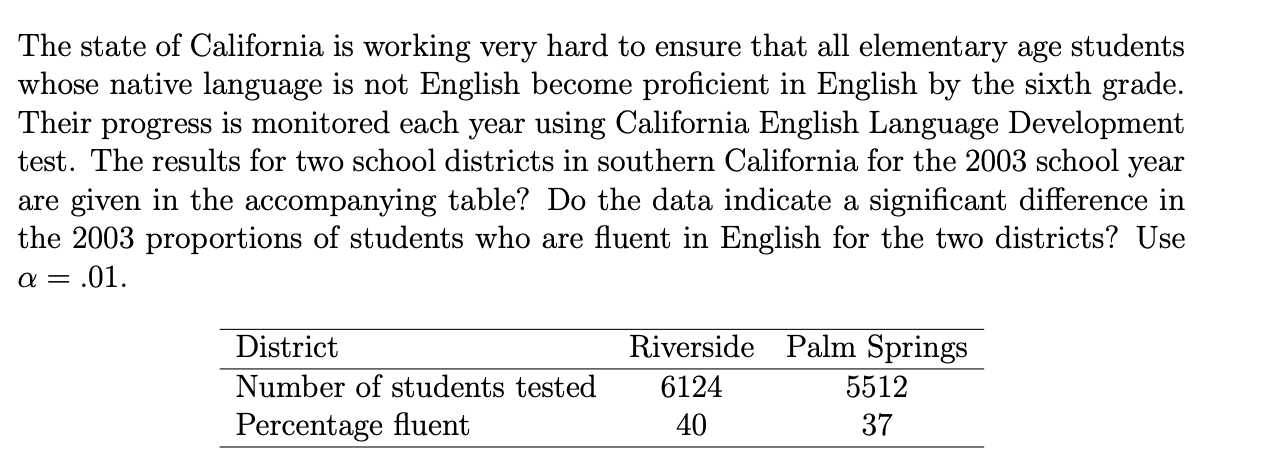
The data for a random sample of 10 paired observations are shown in the following table. Pair Population 1 Population 2 19 24 25 27 31 36 52 53 49 55 5 0 00 -TOO CT A CO NO H 34 34 59 66 47 51 17 20 51 55 (a) If you wish to test whether these data are sufficient to indicate that the mean for population 2 is larger than that for population 1, what are the appropriate null and alternative hypotheses? Define any symbols you use. (b) Conduct the test from part (a), using a = 0.10. What is your decision? c Find a 90% confidence interval for Ma. Interpret this interval. (d) What assumptions are necessary to ensure the validity of the preceding analysis?The state of California is working very hard to ensure that all elementary age students whose native language is not English become proficient in English by the sixth grade. Their progress is monitored each year using California English Language Development test. The results for two school districts in southern California for the 2003 school year are given in the accompanying table? Do the data indicate a significant difference in the 2003 proportions of students who are fluent in English for the two districts? Use a =.01. District Riverside Palm Springs Number of students tested 6124 5512 Percentage fluent 40 37
Step by Step Solution
There are 3 Steps involved in it

Get step-by-step solutions from verified subject matter experts