Question: Please help to figure out data analysis (like calculation questions) at the bottom of the screenshot based on the statistics that showed in this case,
Please help to figure out data analysis (like calculation questions) at the bottom of the screenshot based on the statistics that showed in this case, and it is not necessary to write the whole essay. Thanks!
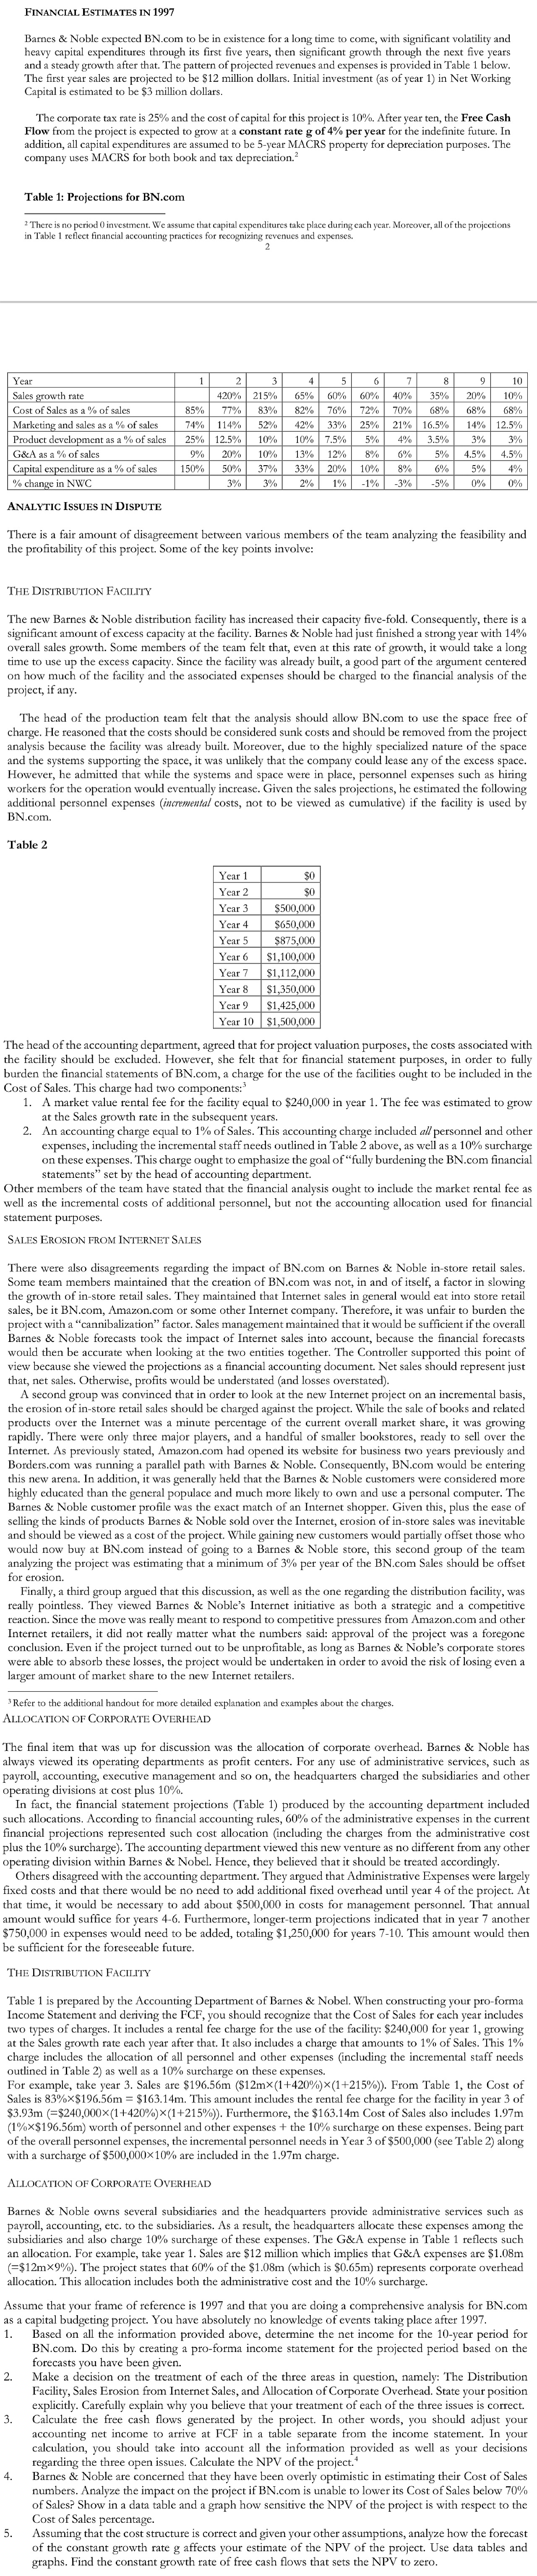
FINANCIAL ESTIMATES IN 1997 Barnes & Noble expected BN.com to be in existence for a long time to come, with significant volatility and heavy capital expenditures through its first five years, then significant growth through the next five years and a steady growth after that. The pat er that. The pattern of projected revenues and expenses is provided in Table 1 below. The first year sales are projected to be $12 million dollars. Initial investment (as of year 1) in Net Working Capital is estimated to be $3 million dollars. The corporate tax rate is 25% and the cost of capital for this project is 10%. After year ten, the Free Cash Flow from the project is expected to grow at a constant rate g of 4% per year for the indefinite future. In addition, all capital expenditures are assumed to be 5-year MACRS property for depreciation purposes. The company uses MACRS for both book and tax depreciation." Table 1: Projections for BN.com in Table irenedemandsmentweassume that capital expenditures take place during each year. Moreover, all of the projections Year Sales growth rate 420% 215% 40% 35%% 209 29 10 Cost of Sales as a % of sales 85% 77% 83% 82% 76% 72% 70% 68% 68% 68% Marketing and sales as a % of sales 74% 114% 52% 42% 33% 25% 21% 16.5% 14% 12.5% Product development as a % of sales 25% 12.5% 10% 10% 7.5% 4% 3.5% 3% G&A as a % of sales 9% 20% 10% 13% 12% 8% 6% 5% 4.5% 4.5% Capital expenditure as a % of sales 150% 50% 37% 33% 20% 10% 8% 6% 5% 4% 70 change in NWC 3% 3% 2% 1% -1% -3% -5% 0% 0% ANALYTIC ISSUES IN DISPUTE There is a fair amount of disagreement between various members of the team analyzing the feasibility and the profitability of this project. Some of the key points involve: THE DISTRIBUTION FACILITY The new Barnes & Noble distribution facility has increased their capacity five-fold. Consequently, there is a significant amount of excess capacity at the facility. Barnes & Noble had just finished a strong year with 14% overall sales growth. Some members of the team felt that, even at this rate of growth, it would take a long time to use up the excess capacity. Since the facility was already built, a good part of the argument centered on how much of the facility and the associated expenses should be charged to the financial analysis of the project, if any. The head of the production team felt that the analysis should allow BN.com to use the space free of charge. He reasoned that the costs should be considered sunk costs and should be removed from the project analysis because the facility was already built. Moreover, due to the highly specialized nature of the space and the systems supporting the space, it was unlikely that the company could lease any of the excess space. However, he admitted that while the systems and space were in place, personnel expenses such as hiring workers for the operation would eventually increase. Given the sales projections, he estimated the following additional personnel expenses (incremental costs, not to be viewed as cumulative) if the facility is used by BN.com. Table 2 Year 1 Year 2 Year 3 $500,000 Year 4 $650,000 Year 5 $875,000 Year 6 $1,100,000 Year 7 $1,112,000 Year 8 $1,350,000 Year 9 $1,425,000 Year 10 $1,500,000 The head of the accounting department, agreed that for project valuation purposes, the costs associated with the facility should be excluded. However, she felt that for financial statement purposes, in order to fully burden the financial statements of BN.com, a charge for the use of the facilities ought to be included in the Cost of Sales. This charge had two components:' 1. A market value rental fee for the facility equal to $240,000 in year 1. The fee was estimated to grow at the Sales growth rate in the subseque An accounting charge equal to 1% of Sales. This accounting charge included all personnel and other expenses, including the incremental staff needs outlined in Table 2 above, as well as a 10% surcharge on these expenses. This charge ought to emphasize the goal of "fully burdening the BN.com financial statements" set by the head of accounting department. Other members of the team have stated that the financial analysis ought to include the market rental fee a well as the incremental costs of additional personnel, but not the accounting allocation used for financial SALES EROSION FROM INTERNET SALES There were also disagreements regarding the impact of BN.com on Barnes & Noble in-store retail sales. Some team members maintained that the creation of BN.com was not, in and of itself, a factor in slowing growth of in-store retail sales. They maintained that Internet sales in general would eat into store retail sales, be it BN.com, Amazon.com or some other Internet company. Therefore, it was unfair to burden the project with a "cannibalization" factor. Sales it maintained that it would be sufficient if the overall Barnes & Noble forecasts took the impact of Internet sales into account, because the financial forecasts would then be accurate when looking at the two entities together. The Controller supported this point of view because she viewed the projections as a financial accounting document. Net sales should represent just that, net sales. Otherwise, profits would be understated (and losses overstated). A second group was convinced that in order to look at the new Internet project on an incremental basis, the erosion of in-store retail sales should be charged against the project. While the sale of books and related products over the Internet was a minute percentage of the current overall market share, it was growing rapidly. There were only three major players, and a handful of smalle bookstores, ready to sell over the Internet. As previously stated, Amazon.com had opened its website for business two years previously and Borders.com was ru running a parallel path with Barnes & Noble. Consequently, BN.com would be entering this new arena. In addition, it was generally held that the Barnes & Noble custo ere considered more highly educated than the general populace and much more likely to own and use a computer. The Barnes & Noble customer profile was the exact match of an Int shopper. Given this, plus the ease of selling the kinds of products Barnes & Noble sold over the Internet, erosion of in-store sales was inevitable and should be viewed as a cost of the project. While gaining new customers would partially offset those who would now buy at BN.com instead of going to a Barnes & Noble store, this second group of the team analyzing the project was estimating that a minimum of 3% per year of the BN.com Sales should be offset for erosion. Finally, a third group argued that this discussion, as well as the on garding the distribution facility, was really pointless. They viewed Barnes & Noble's Internet initiative as both a strategic and a competitive reaction. Since the move was really meant to respond to competitive pressures from Amazon.com and other Internet retailers, it did not really matte t the numbers said: approval of the project was a foregone conclusion. Even if the project turned out to be unprofitable, as long as Barnes & Noble's corporate stores were able to absorb these losses, the project would be undertaken in order to avoid the risk of losing even a larger amount of market share to the new Internet retailers. 3Refer to the additional handout for more detailed explanation and examples about the charges. ALLOCATION OF CORPORATE OVERHEAD The final item that was up for discussion was the allocation of corporate overhead. Barnes & Noble has always viewed its operating departments as profit centers. For any use of administrative services, such as payroll, accounting, executive management and so on, the headquarters charged the subsidiaries and other operating divisions at cost plus 10%. In fact, the financial statement projections (Table 1) produced by the accounting department included such allocations. According to financial accounting rules, 60% of the administrative expenses in th inancial projections represented such cost allocation (including the charges from the administrative cost lus the 10% surcharg enture as no different from any other operating division within Barnes & Nobel. Hence, they believed that it sh Others disagreed with the accounting depa strative Expenses were largely fixed costs and that there would be no need to add additional fixed overhead until year 4 of the project. At that time, it would be necessary to add about $500,000 in costs for management personnel. That annual amount would suffice for years 4-6. Furthermore, longer-term projections indicated that in year 7 another $750,000 in expenses would need to be added, totaling $1,250,000 for years 7-10. This amount would then e sufficient for the foreseeable future. THE DISTRIBUTION FACILITY Table 1 is prepared by the Accounting Department of Barnes & Nobel. When constructing your pro-forma Income Statement and deriving the FCF, you should recognize that the Cost of Sales for each year includes two types of charges. It includes a rental fee charge for the use of the facility: $240,000 for year 1, growing at the Sales growth rate each year after that. It also includes a charge that amounts to 1% of Sales. This 1% charge includes the allocation of all personnel and other expenses (including the incremental staff needs outlined in Table 2) as well as a 10% surcharge on these expenses. For example, take year 3. Sales are $196.56m ($12mx(1+420%)x(1+215%)). From Table 1, the Cost of Sales is 83%*$196.56m = $163.14m. This amount includes the rental fee charge for the facility in year 3 of $3.93m (=$240,000x(1+420%) x(1+215%)). Furthermore, the $163.14m Cost of Sales also includes 1.97m (1%*$196.56m) worth of personnel and other expenses + the 10% surcharge on these expenses. Being part of the overall personnel expenses, the incremental personnel needs in Year 3 of $500,000 (see Table 2) along with a surcharge of $500,000*10% are included in the 1.97m charge. ALLOCATION OF CORPORATE OVERHEAD Barnes & Noble owns several subsidiaries and the headquarters provide administrative services such as payroll, accounting, etc. to the subsidiaries. As a result, the headquarters allocate these expenses among the subsidiaries and also charge 10% surcharge of these expenses. The G&A expense in Table 1 reflects such an allocation. For example, take year 1. Sales are $12 million which implies that G&A expenses are $1.08m (=$12mx9%). The project states that 60% of the $1.08m (which is $0.65m) represents corporate overhead allocation. This allocation includes both the administrative cost and the 10% surcharge. Assume that your frame of reference is 1997 and that you are doing a comprehensive analysis for BN.com is a capital budgeting project. You have absolutely no knowledge of events taking place after 1997. 1. Based on all the information provided above, determine the net income for the 10-year period for BN.com. Do this by creating a pro-forma income statement for the projected period based on the forecasts you have been given. Make a decision on the treatment of each of the three areas in question, namely: The Distribution Facility, Sales Erosion from Internet Sales, and Allocation of Corporate Overhead. State your position explicitly. Carefully explain why you believe that your treatment of each of the three issues is correct. Calculate the free cash flows generated project. In other words, you should adjust your accounting net income t separate from the income statement. In your calculation, you should take into account all the infor ding the three open issues. Calculate the NPV of the project.* information provided as well as your decisions Barnes & Noble are concerned that they have been overly optimistic in estimating their Cost of Sales numbers. Analyze the impact on the project if BN.com is unable to lower its Cost of Sales below 70% of Sales? Show in a data table e the NPV of the project is with respect to the Cost of Sales perce Assuming that the cost structure is correct and given your other assumptions, analyze how the forecast of the constant growth rate g affects your estimate of the NPV of the project. Use data tables and graphs. Find the constant growth rate of free cash flows that sets the NPV to zero
Step by Step Solution
There are 3 Steps involved in it
1 Expert Approved Answer
Step: 1 Unlock
Question Has Been Solved by an Expert!
Get step-by-step solutions from verified subject matter experts
Step: 2 Unlock
Step: 3 Unlock
Students Have Also Explored These Related Finance Questions!