

Question: Please help to Ratio analysis list below for financial projections for three years below Note currency in riyals Ratio Profitability ratios Return on assets Return
Please help to Ratio analysis list below for financial projections for three years below Note currency in riyals 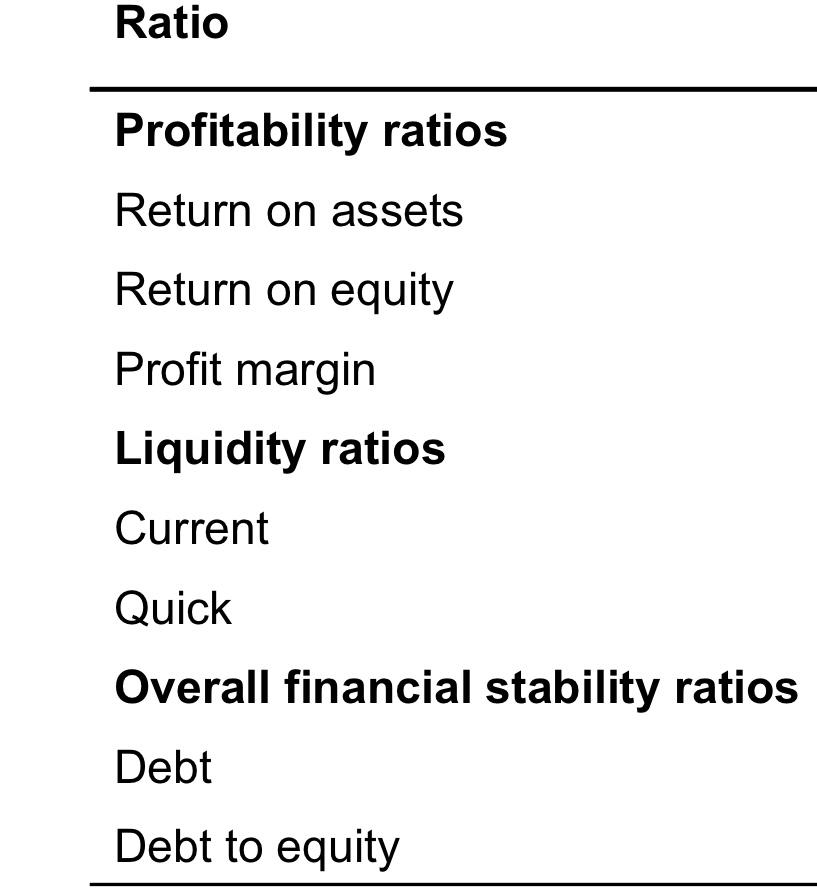
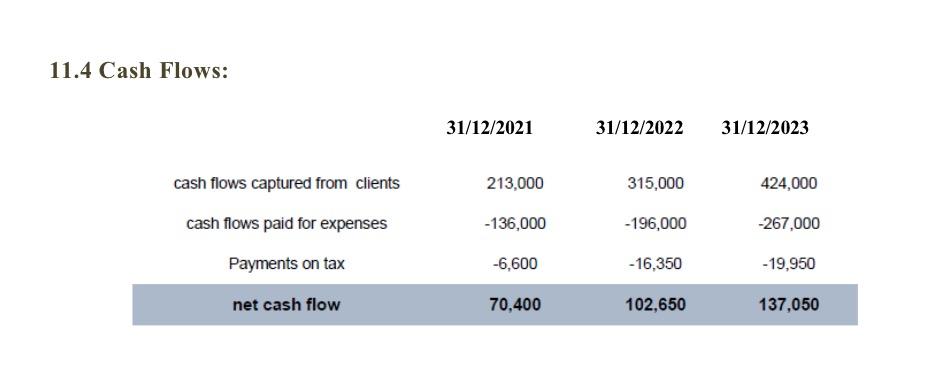
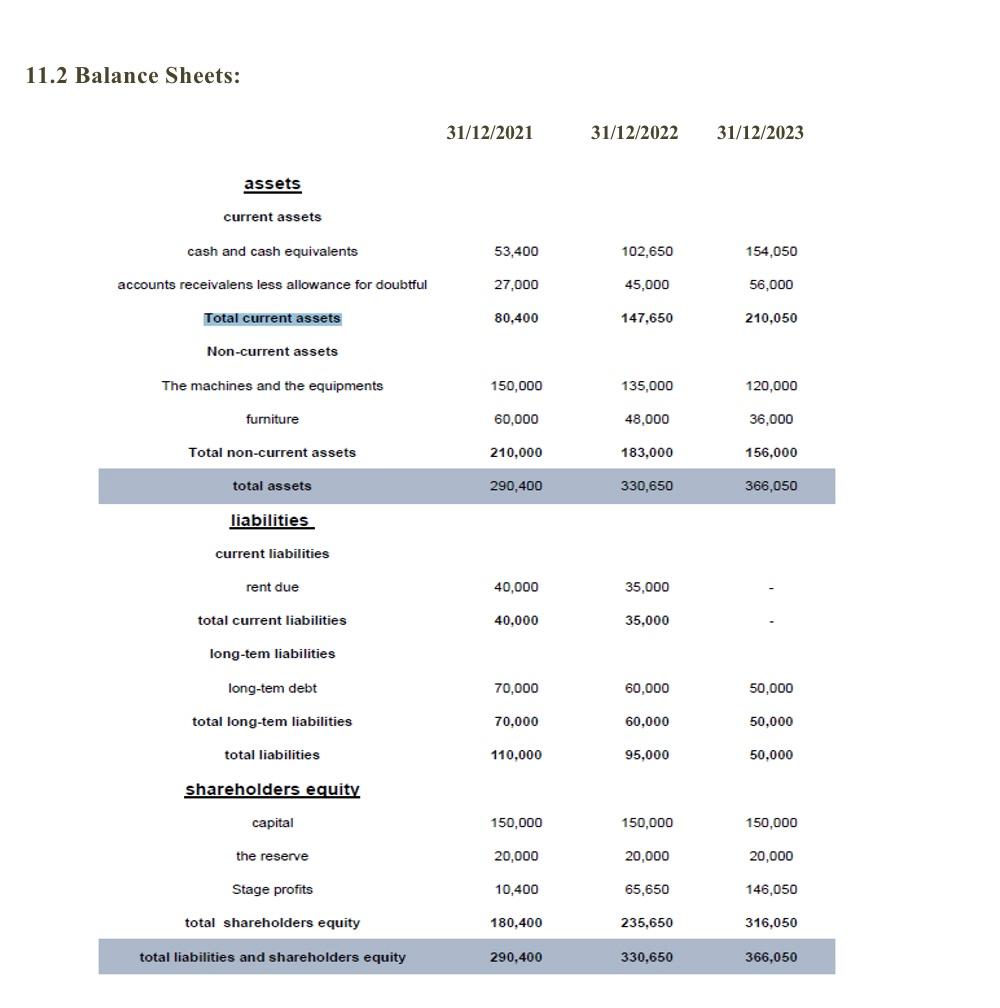
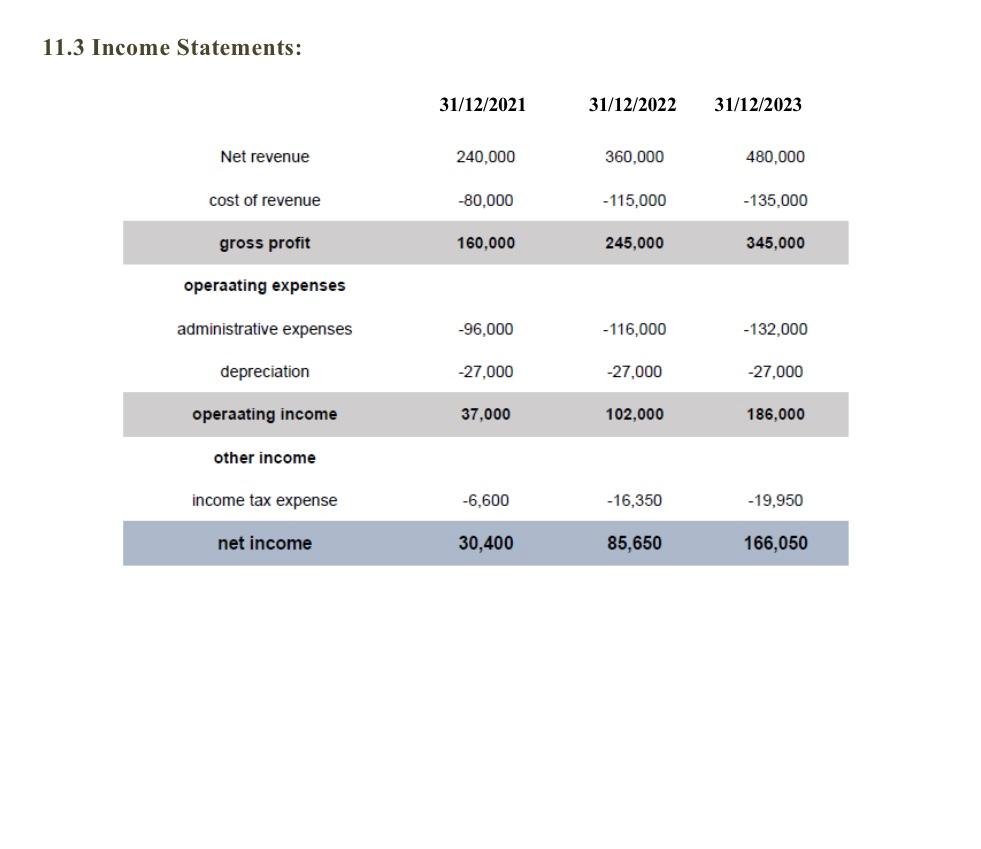
Ratio Profitability ratios Return on assets Return on equity Profit margin Liquidity ratios Current Quick Overall financial stability ratios Debt Debt to equity 11.4 Cash Flows: 31/12/2021 31/12/2022 31/12/2023 cash flows captured from clients 213,000 315,000 424,000 cash flows paid for expenses -136,000 -196,000 -267,000 Payments on tax -6,600 -16,350 -19,950 net cash flow 70,400 102,650 137,050 11.2 Balance Sheets: 31/12/2021 31/12/2022 31/12/2023 assets current assets cash and cash equivalents 53,400 102,650 154,050 accounts receivalens less allowance for doubtful 27,000 45,000 56,000 Total current assets 80,400 147,650 210,050 Non-current assets The machines and the equipments 150,000 135,000 120,000 furniture 60,000 48,000 36,000 Total non-current assets 210,000 183,000 156,000 total assets 290,400 330,650 366,050 liabilities current liabilities rent due 40,000 35,000 total current liabilities 40,000 35,000 long-tem liabilities long-tem debt 70,000 60,000 50,000 total long-tem liabilities 70,000 60,000 50,000 total liabilities 110,000 95,000 50,000 shareholders equity capital 150,000 150,000 150,000 the reserve 20,000 20,000 20,000 Stage profits 10,400 65,650 146,050 total shareholders equity 180,400 235,650 316,050 total liabilities and shareholders equity 290,400 330.650 366,050 11.3 Income Statements: 31/12/2021 31/12/2022 31/12/2023 Net revenue 240,000 360,000 480,000 cost of revenue -80,000 - 115,000 -135,000 gross profit 160,000 245,000 345,000 operaating expenses administrative expenses -96,000 -116,000 -132,000 depreciation -27,000 -27,000 -27,000 operaating income 37,000 102,000 186,000 other income income tax expense -6,600 -16,350 -19,950 net income 30,400 85,650 166,050
Step by Step Solution
There are 3 Steps involved in it

Get step-by-step solutions from verified subject matter experts