

Question: Please help understand how to do this. Per capita GDP: Using the following data, organize from the largest to smallest, according to the rate of
Please help understand how to do this.
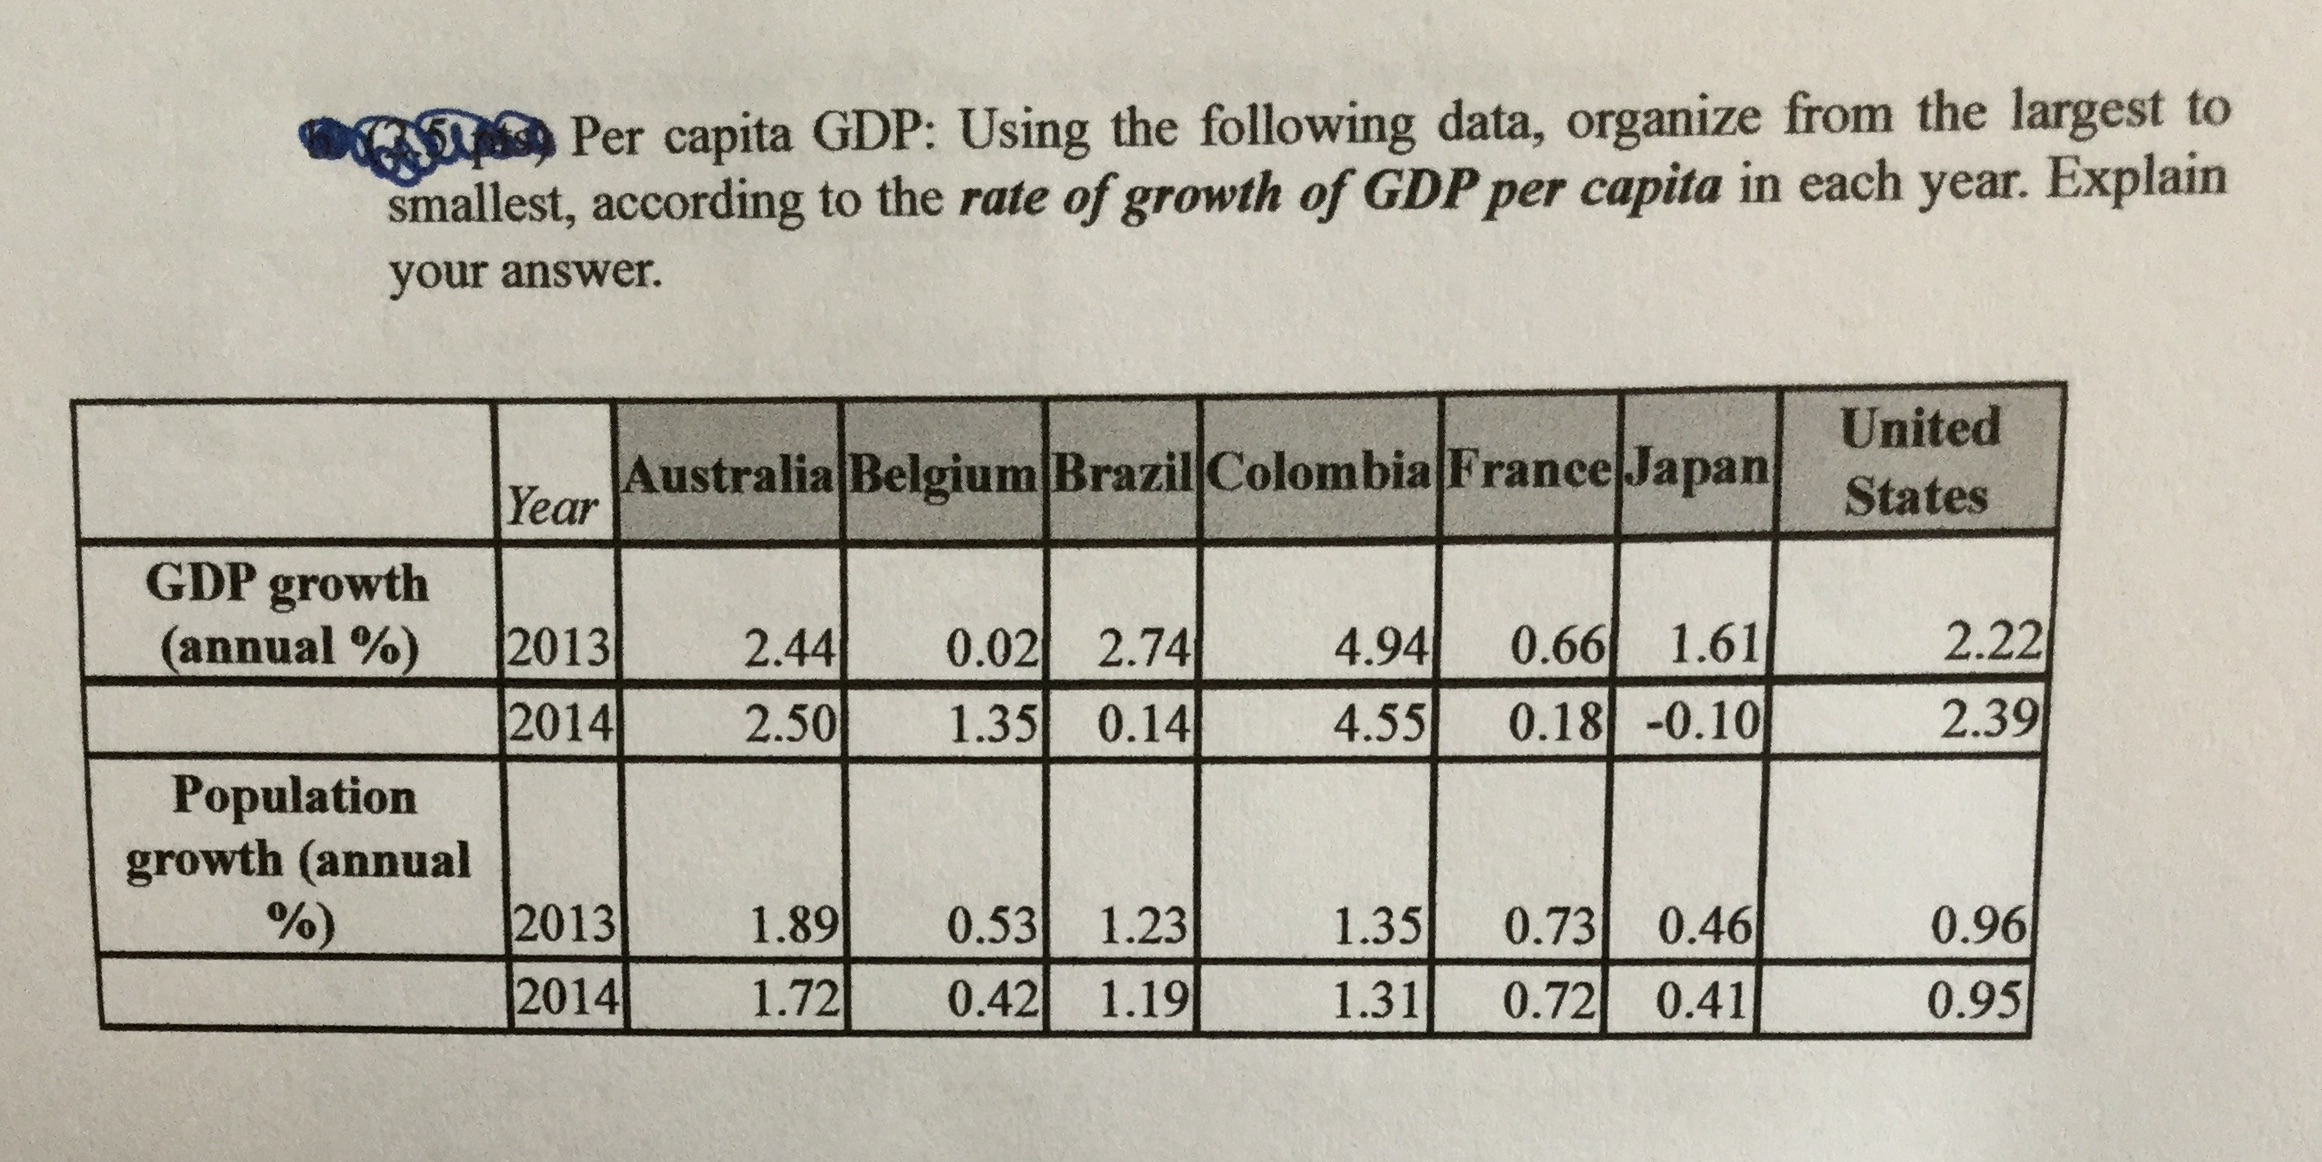
Per capita GDP: Using the following data, organize from the largest to smallest, according to the rate of growth of GDP per capita in each year. Explain your answer. United Year Australia Belgium Brazil Colombia France Japan States GDP growth (annual %) 2013 2.44 0.02 2.74 4.94 0.66 1.61 2.22 2014 2.50 1.35 0.14 4.55 0.18 -0.10 2.39 Population growth (annual %) 2013 1.89 0.53 1.23 1.35 0.73 0.46 0.96 2014 1.72 0.42 1.19 1.31 0.72 0.41 0.95
Step by Step Solution
There are 3 Steps involved in it
1 Expert Approved Answer
Step: 1 Unlock

Question Has Been Solved by an Expert!
Get step-by-step solutions from verified subject matter experts
Step: 2 Unlock
Step: 3 Unlock