

Question: please help Use the Census table to construct a scatter plot matrix on the four numerical variables. Match the pairs of variables on the left
please help 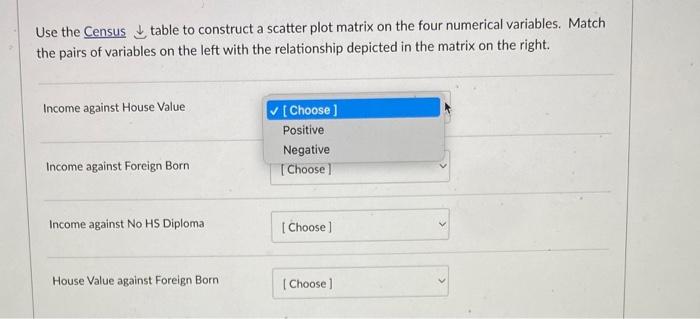
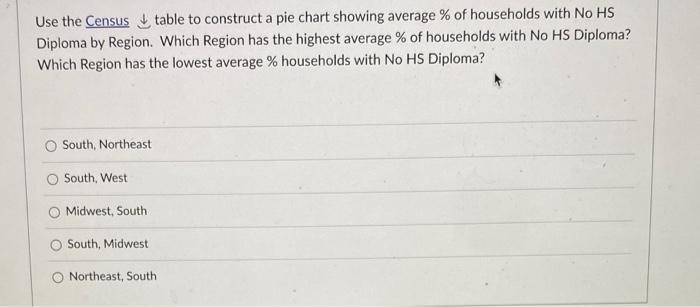
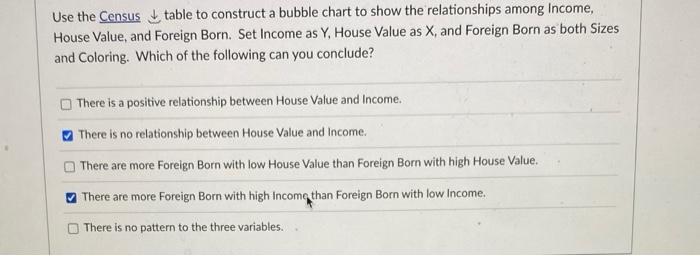
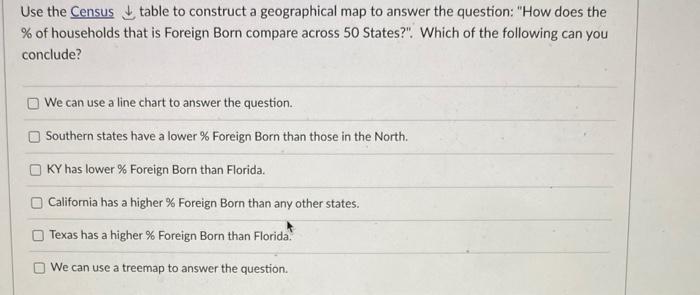
Use the Census table to construct a scatter plot matrix on the four numerical variables. Match the pairs of variables on the left with the relationship depicted in the matrix on the right. Income against House Value Income against Foreign Born Income against No HS Diploma House Value against Foreign Born Use the Census table to construct a pie chart showing average \% of households with No HS Diploma by Region. Which Region has the highest average \% of households with No HS Diploma? Which Region has the lowest average \% households with No HS Diploma? South, Northeast South, West Midwest, South South, Midwest Northeast, South Use the Census table to construct a bubble chart to show the relationships among income, House Value, and Foreign Born. Set Income as Y, House Value as X, and Foreign Born as both Sizes and Coloring. Which of the following can you conclude? There is a positive relationship between House Value and Income. There is no relationship between House Value and income. There are more Foreign Born with low House Value than Foreign Born with high House Value. There are more Foreign Born with high Income than Foreign Born with low Income. There is no pattern to the three variables. Use the Census table to construct a geographical map to answer the question: "How does the \% of households that is Foreign Born compare across 50 States?". Which of the following can you conclude? We can use a line chart to answer the question. Southern states have a lower \% Foreign Born than those in the North. KY has lower \% Foreign Born than Florida. California has a higher % Foreign Born than any other states. Texas has a higher % Foreign Born than Florida. We can use a treemap to answer the question. Use the Census table to construct a scatter plot matrix on the four numerical variables. Match the pairs of variables on the left with the relationship depicted in the matrix on the right. Income against House Value Income against Foreign Born Income against No HS Diploma House Value against Foreign Born Use the Census table to construct a pie chart showing average \% of households with No HS Diploma by Region. Which Region has the highest average \% of households with No HS Diploma? Which Region has the lowest average \% households with No HS Diploma? South, Northeast South, West Midwest, South South, Midwest Northeast, South Use the Census table to construct a bubble chart to show the relationships among income, House Value, and Foreign Born. Set Income as Y, House Value as X, and Foreign Born as both Sizes and Coloring. Which of the following can you conclude? There is a positive relationship between House Value and Income. There is no relationship between House Value and income. There are more Foreign Born with low House Value than Foreign Born with high House Value. There are more Foreign Born with high Income than Foreign Born with low Income. There is no pattern to the three variables. Use the Census table to construct a geographical map to answer the question: "How does the \% of households that is Foreign Born compare across 50 States?". Which of the following can you conclude? We can use a line chart to answer the question. Southern states have a lower \% Foreign Born than those in the North. KY has lower \% Foreign Born than Florida. California has a higher % Foreign Born than any other states. Texas has a higher % Foreign Born than Florida. We can use a treemap to answer the Step by Step Solution
There are 3 Steps involved in it
1 Expert Approved Answer
Step: 1 Unlock

Question Has Been Solved by an Expert!
Get step-by-step solutions from verified subject matter experts
Step: 2 Unlock
Step: 3 Unlock