

Question: Please help using Excel a . Graph the time series data. What do you observe? b . Compute all possible forecasts using exponential smoothing with
Please help using Excel
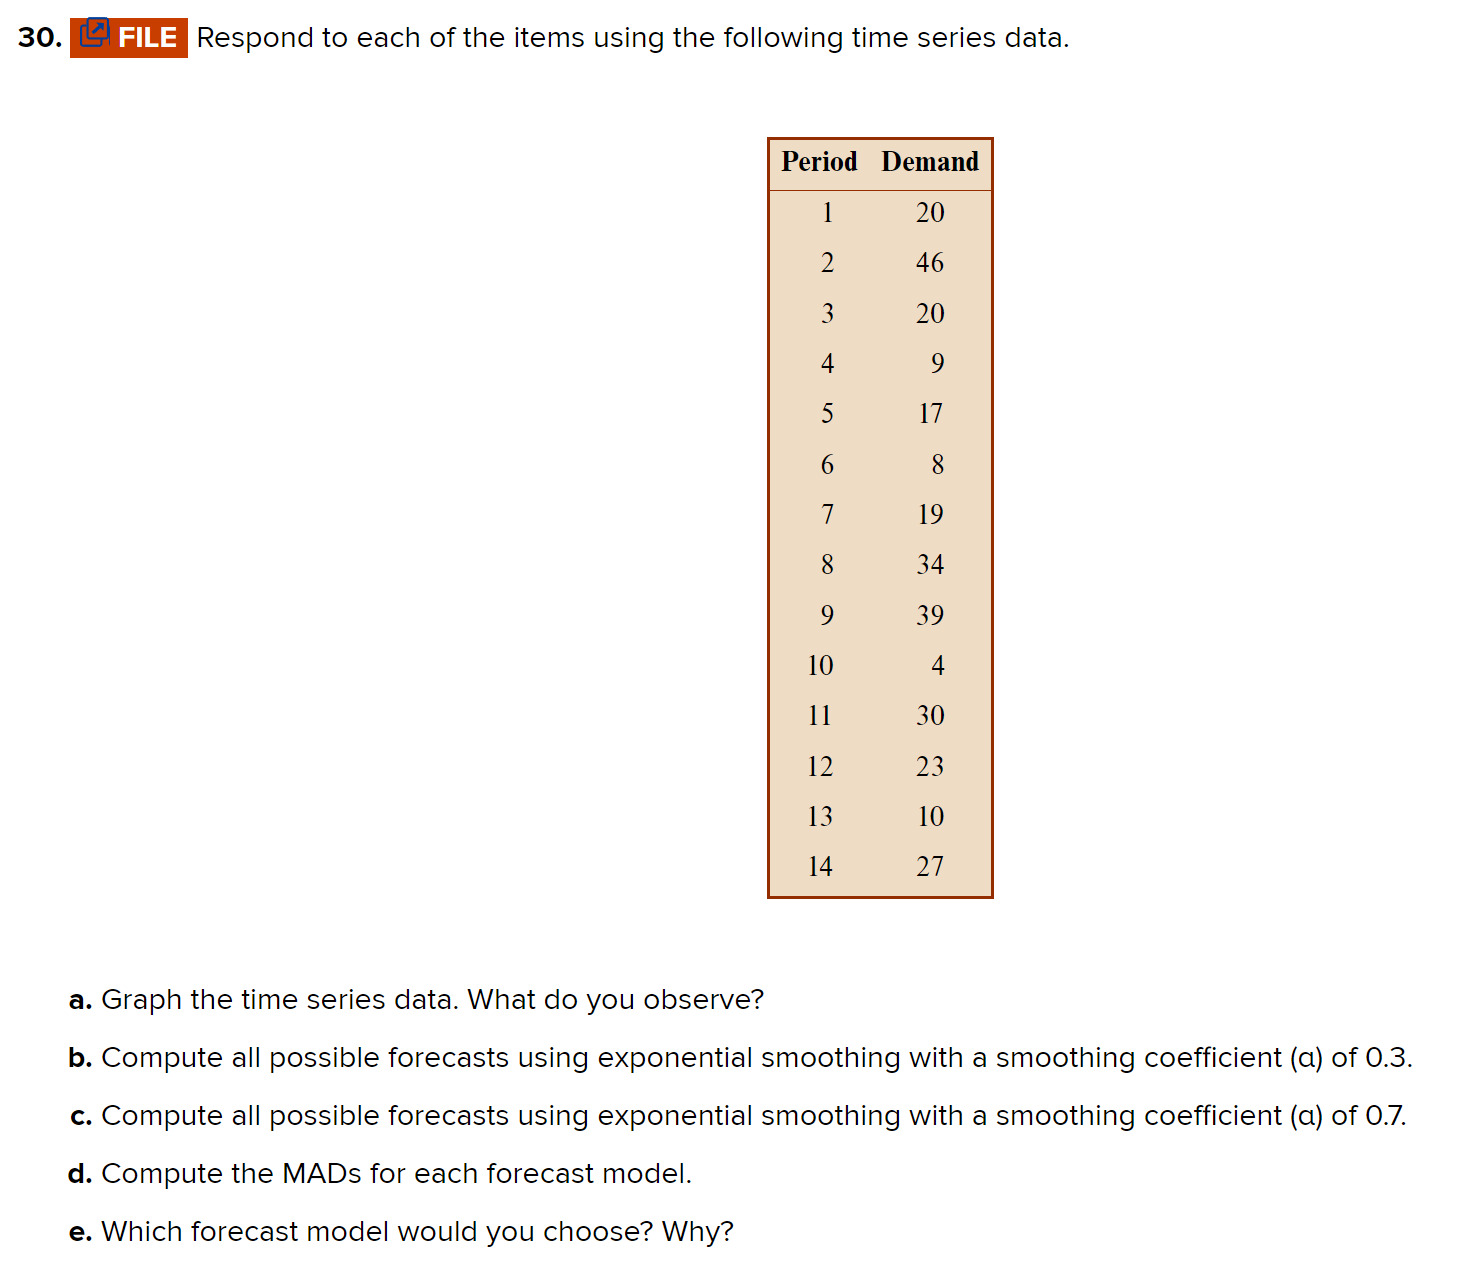
a Graph the time series data. What do you observe?
b Compute all possible forecasts using exponential smoothing with a smoothing coefficient a of
c Compute all possible forecasts using exponential smoothing with a smoothing coefficient a of
d Compute the MADs for each forecast model.
e Which forecast model would you choose? Why?
Step by Step Solution
There are 3 Steps involved in it
1 Expert Approved Answer
Step: 1 Unlock

Question Has Been Solved by an Expert!
Get step-by-step solutions from verified subject matter experts
Step: 2 Unlock
Step: 3 Unlock