

Question: Please help using Scilab 1. Plot the following functions on the same graph for t =- to in an increment of/50. Y1- sin(t) Y2 =
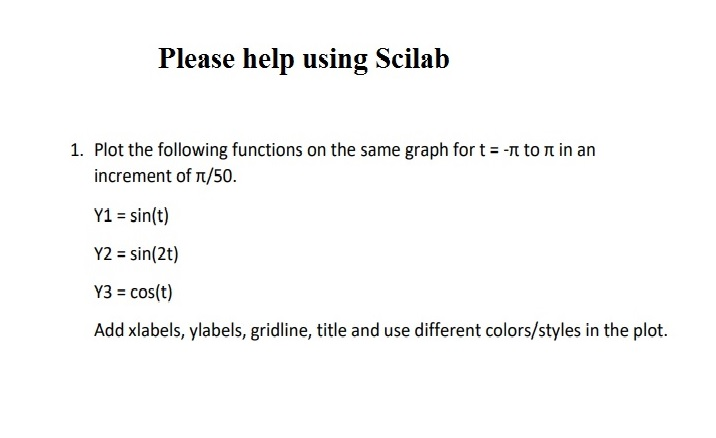
Please help using Scilab 1. Plot the following functions on the same graph for t =- to in an increment of/50. Y1- sin(t) Y2 = sin(2t) V3-cos(t) Add xlabels, ylabels, gridline, title and use different colors/styles in the plot. Please help using Scilab 1. Plot the following functions on the same graph for t =- to in an increment of/50. Y1- sin(t) Y2 = sin(2t) V3-cos(t) Add xlabels, ylabels, gridline, title and use different colors/styles in the plot
Step by Step Solution
There are 3 Steps involved in it
1 Expert Approved Answer
Step: 1 Unlock

Question Has Been Solved by an Expert!
Get step-by-step solutions from verified subject matter experts
Step: 2 Unlock
Step: 3 Unlock