

Question: Please help, using the information in image below, answer these questions from a project where I used 30 different prices of 2018 Jeep Grand Cherokee's
Please help, using the information in image below, answer these questions from a project where I used 30 different prices of 2018 Jeep Grand Cherokee's to find the confidence interval for mean. Show any calculations!
- Set your level of confidence and state why you set it at this level.
- Determine whether or not your sample data should be used to estimate . Provide any analysis or graphs used to make this determination. If the data should not be used to estimate the parameter clearly state why.
- Construct your confidence interval (even if you determine that the data is unusable). State the margin of error. Build a sentence that interprets the meaning of the interval you've created.
Vehicle Prices ($):278973215035678348923400036024322593280032911359923299530359334503199537900359073557534200269953199135000339993700034997342003530032995314953450032990
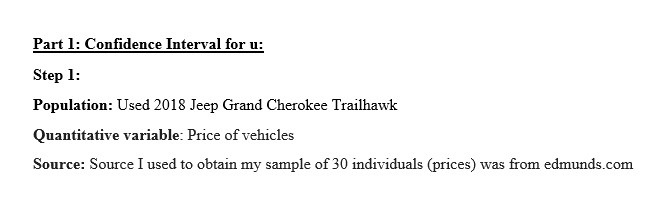
Part 1: Confidence Interval for u: Step 1: Population: Used 2018 Jeep Grand Cherokee Trailhawk Quantitative variable: Price of vehicles Source: Source I used to obtain my sample of 30 individuals (prices) was from edmunds.com
Step by Step Solution
There are 3 Steps involved in it
1 Expert Approved Answer
Step: 1 Unlock

Question Has Been Solved by an Expert!
Get step-by-step solutions from verified subject matter experts
Step: 2 Unlock
Step: 3 Unlock