

Question: Please help verify my liabilities calculation? My professor did a poor job showing calculations and I'm positive I did something wrong. Balance Sheet Annual Standardised
Please help verify my liabilities calculation? My professor did a poor job showing calculations and I'm positive I did something wrong.
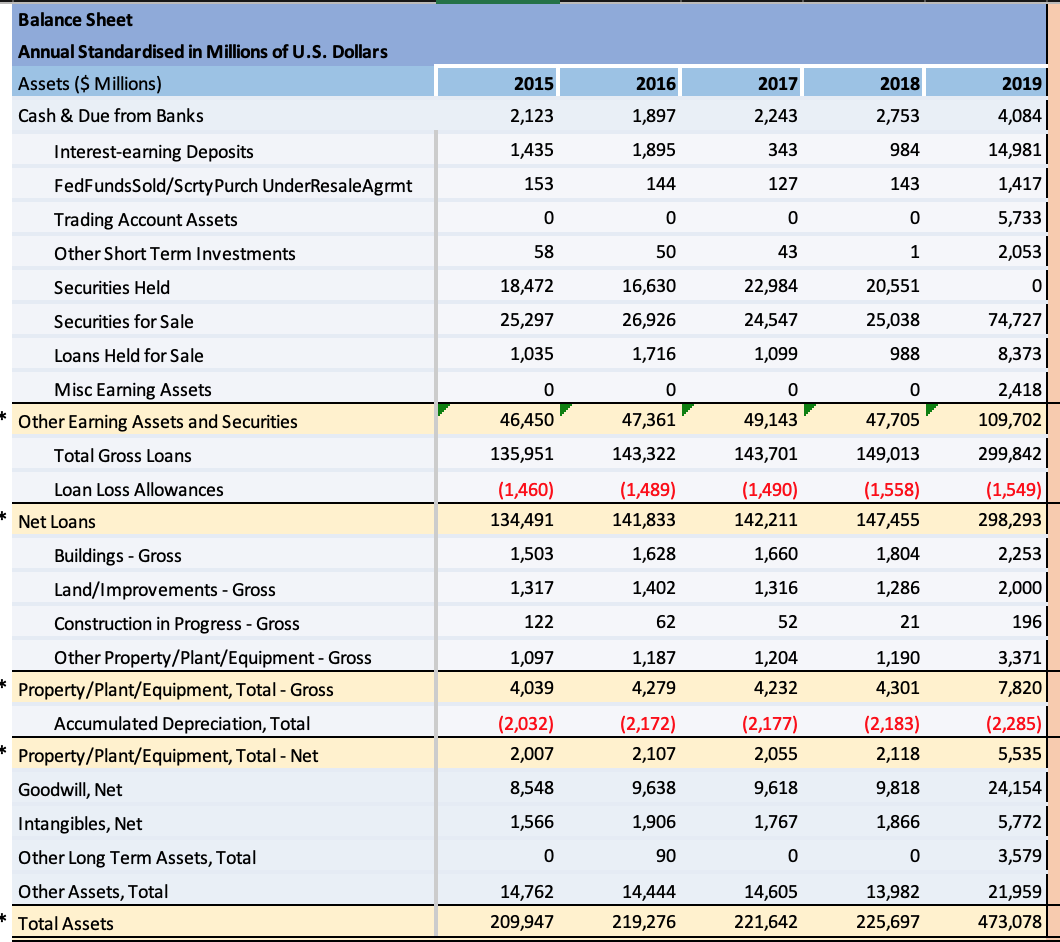
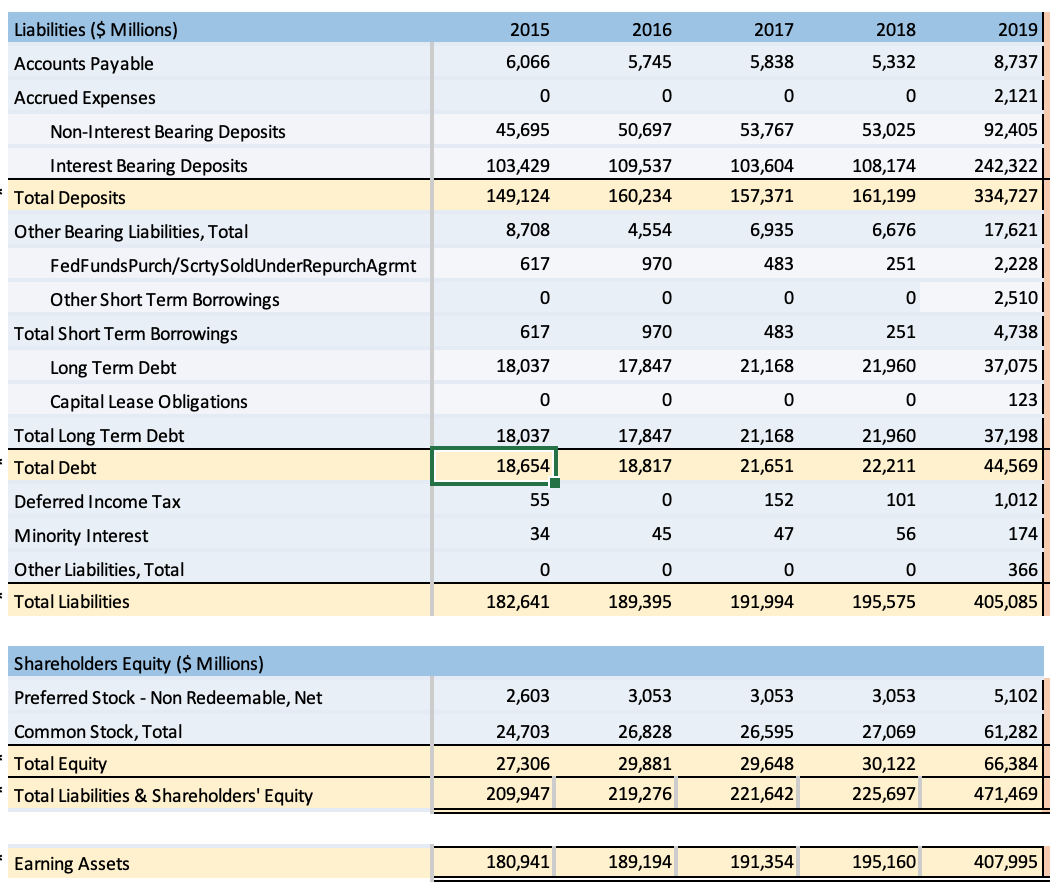
Balance Sheet Annual Standardised in Millions of U.S. Dollars Assets ($ Millions) Cash & Due from Banks 2015 2016 2017 2018 2019 2,123 2,243 2,753 1,897 1,895 1,435 343 984 Interest-earning Deposits FedFundsSold/Scrty Purch UnderResaleAgrmt Trading Account Assets 4,084 14,981 1,417 153 144 127 143 0 0 0 0 5,733 Other Short Term Investments 58 50 43 1 2,053 Securities Held 18,472 22,984 20,551 16,630 26,926 Securities for Sale 25,297 24,547 25,038 74,727 Loans Held for Sale 1,035 1,716 1,099 988 8,373 0 0 0 0 Misc Earning Assets Other Earning Assets and Securities Total Gross Loans 2,418 109,702 * 46,450 49,143 47,705 135,951 149,013 Loan Loss Allowances (1,460) 134,491 47,361 143,322 (1,489) 141,833 1,628 143,701 (1,490) 142,211 (1,558) 147,455 * Net Loans 299,842 (1,549) 298,293 2,253 2,000 196 1,503 1,660 1,804 1,317 1,402 1,316 1,286 122 62 52 21 1,097 1,204 1,187 4,279 1,190 4,301 3,371 7,820 4,039 Buildings - Gross Land/Improvements - Gross Construction in Progress - Gross Other Property/Plant/Equipment - Gross Property/Plant/Equipment, Total - Gross Accumulated Depreciation, Total * Property/Plant/Equipment, Total - Net Goodwill, Net Intangibles, Net Other Long Term Assets, Total Other Assets, Total (2,032) 2,007 8,548 (2,172) 2,107 9,638 4,232 (2,177) 2,055 9,618 (2,183) 2,118 9,818 (2,285) 5,535 24,154 5,772 3,579 1,566 1,906 1,767 1,866 0 90 0 0 14,762 209,947 14,444 219,276 14,605 221,642 13,982 225,697 21,959 473,078 * Total Assets 2015 2016 2017 2018 2019 6,066 5,745 5,838 5,332 8,737 0 0 0 0 2,121 45,695 50,697 53,767 53,025 92,405 103,429 149,124 109,537 160,234 4,554 103,604 157,371 Liabilities ($ Millions) Accounts Payable Accrued Expenses Non-Interest Bearing Deposits Interest Bearing Deposits Total Deposits Other Bearing Liabilities, Total FedFunds Purch/Scrty SoldUnderRepurchAgrmt Other Short Term Borrowings Total Short Term Borrowings Long Term Debt Capital Lease Obligations Total Long Term Debt 108,174 161,199 242,322 334,727 17,621 2,228 8,708 6,935 6,676 617 970 483 251 0 0 0 2,510 617 970 483 251 4,738 18,037 17,847 21,168 21,960 37,075 0 0 0 0 123 18,037 18,654 17,847 18,817 21,168 21,651 21,960 22,211 Total Debt 37,198 44,569 1,012 Deferred Income Tax 55 0 152 101 34 45 47 56 174 Minority Interest Other Liabilities, Total 0 0 0 0 366 Total Liabilities 182,641 189,395 191,994 195,575 405,085 2,603 3,053 3,053 3,053 5,102 Shareholders Equity ($ Millions) Preferred Stock - Non Redeemable, Net Common Stock, Total Total Equity Total Liabilities & Shareholders' Equity 24,703 27,306 209,947 26,828 29,881 219,276 26,595 29,648 221,642 27,069 30,122 225,697 61,282 66,384 471,469 Earning Assets 180,941 189,194 191,354 195,160 407,995 Balance Sheet Annual Standardised in Millions of U.S. Dollars Assets ($ Millions) Cash & Due from Banks 2015 2016 2017 2018 2019 2,123 2,243 2,753 1,897 1,895 1,435 343 984 Interest-earning Deposits FedFundsSold/Scrty Purch UnderResaleAgrmt Trading Account Assets 4,084 14,981 1,417 153 144 127 143 0 0 0 0 5,733 Other Short Term Investments 58 50 43 1 2,053 Securities Held 18,472 22,984 20,551 16,630 26,926 Securities for Sale 25,297 24,547 25,038 74,727 Loans Held for Sale 1,035 1,716 1,099 988 8,373 0 0 0 0 Misc Earning Assets Other Earning Assets and Securities Total Gross Loans 2,418 109,702 * 46,450 49,143 47,705 135,951 149,013 Loan Loss Allowances (1,460) 134,491 47,361 143,322 (1,489) 141,833 1,628 143,701 (1,490) 142,211 (1,558) 147,455 * Net Loans 299,842 (1,549) 298,293 2,253 2,000 196 1,503 1,660 1,804 1,317 1,402 1,316 1,286 122 62 52 21 1,097 1,204 1,187 4,279 1,190 4,301 3,371 7,820 4,039 Buildings - Gross Land/Improvements - Gross Construction in Progress - Gross Other Property/Plant/Equipment - Gross Property/Plant/Equipment, Total - Gross Accumulated Depreciation, Total * Property/Plant/Equipment, Total - Net Goodwill, Net Intangibles, Net Other Long Term Assets, Total Other Assets, Total (2,032) 2,007 8,548 (2,172) 2,107 9,638 4,232 (2,177) 2,055 9,618 (2,183) 2,118 9,818 (2,285) 5,535 24,154 5,772 3,579 1,566 1,906 1,767 1,866 0 90 0 0 14,762 209,947 14,444 219,276 14,605 221,642 13,982 225,697 21,959 473,078 * Total Assets 2015 2016 2017 2018 2019 6,066 5,745 5,838 5,332 8,737 0 0 0 0 2,121 45,695 50,697 53,767 53,025 92,405 103,429 149,124 109,537 160,234 4,554 103,604 157,371 Liabilities ($ Millions) Accounts Payable Accrued Expenses Non-Interest Bearing Deposits Interest Bearing Deposits Total Deposits Other Bearing Liabilities, Total FedFunds Purch/Scrty SoldUnderRepurchAgrmt Other Short Term Borrowings Total Short Term Borrowings Long Term Debt Capital Lease Obligations Total Long Term Debt 108,174 161,199 242,322 334,727 17,621 2,228 8,708 6,935 6,676 617 970 483 251 0 0 0 2,510 617 970 483 251 4,738 18,037 17,847 21,168 21,960 37,075 0 0 0 0 123 18,037 18,654 17,847 18,817 21,168 21,651 21,960 22,211 Total Debt 37,198 44,569 1,012 Deferred Income Tax 55 0 152 101 34 45 47 56 174 Minority Interest Other Liabilities, Total 0 0 0 0 366 Total Liabilities 182,641 189,395 191,994 195,575 405,085 2,603 3,053 3,053 3,053 5,102 Shareholders Equity ($ Millions) Preferred Stock - Non Redeemable, Net Common Stock, Total Total Equity Total Liabilities & Shareholders' Equity 24,703 27,306 209,947 26,828 29,881 219,276 26,595 29,648 221,642 27,069 30,122 225,697 61,282 66,384 471,469 Earning Assets 180,941 189,194 191,354 195,160 407,995
Step by Step Solution
There are 3 Steps involved in it

Get step-by-step solutions from verified subject matter experts