

Question: please help! we are required to use jupiter notebook. this subject is bioinformatics. this is all that was provided by the teacher. 0.6 0.71 0.6
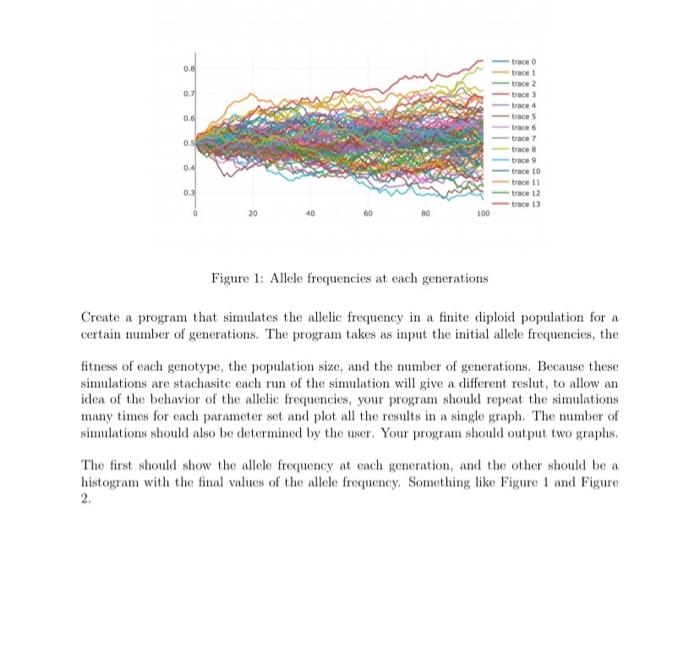
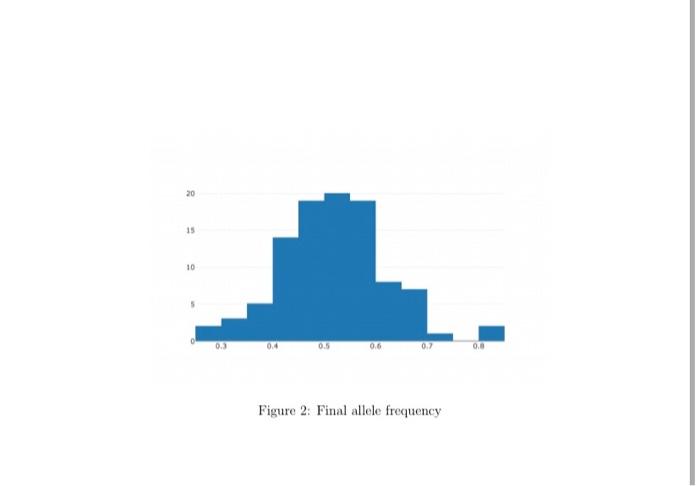
0.6 0.71 0.6 trace trace trace 2 trace trace 4 traces trace 6 trace trace trace 9 trace 10 trace 11 trace 12 trace 13 0.5 0.4 0. 0 20 40 60 30 100 Figure 1: Allele frequencies at each generations Create a program that simulates the allelic frequency in a finite diploid population for a certain number of generations. The program takes as input the initial allele frequencies, the fitness of each genotype, the population size, and the number of generations. Because these simulations are stachasite each run of the simulation will give a different reslut, to allow an idea of the behavior of the allelic frequencies, your program should repeat the simulations many times for each parameter set and plot all the results in a single graph. The number of simulations should also be determined by the user. Your program should output two graphs. The first should show the allele frequency at cach generation, and the other should be a histogram with the final values of the allele frequency. Something like Figure 1 and Figure 2. 20 15 10 0.3 06 0.0 Figure 2: Final allele frequency 0.6 0.71 0.6 trace trace trace 2 trace trace 4 traces trace 6 trace trace trace 9 trace 10 trace 11 trace 12 trace 13 0.5 0.4 0. 0 20 40 60 30 100 Figure 1: Allele frequencies at each generations Create a program that simulates the allelic frequency in a finite diploid population for a certain number of generations. The program takes as input the initial allele frequencies, the fitness of each genotype, the population size, and the number of generations. Because these simulations are stachasite each run of the simulation will give a different reslut, to allow an idea of the behavior of the allelic frequencies, your program should repeat the simulations many times for each parameter set and plot all the results in a single graph. The number of simulations should also be determined by the user. Your program should output two graphs. The first should show the allele frequency at cach generation, and the other should be a histogram with the final values of the allele frequency. Something like Figure 1 and Figure 2. 20 15 10 0.3 06 0.0 Figure 2: Final allele frequency
Step by Step Solution
There are 3 Steps involved in it

Get step-by-step solutions from verified subject matter experts