

Question: Please HELP! What does the liquidity ratio, Financial leverage ratio, asset management ratio, profitability ratio, and market value ratio state for the company? Pl 2020
Please HELP! What does the liquidity ratio, Financial leverage ratio, asset management ratio, profitability ratio, and market value ratio state for the company?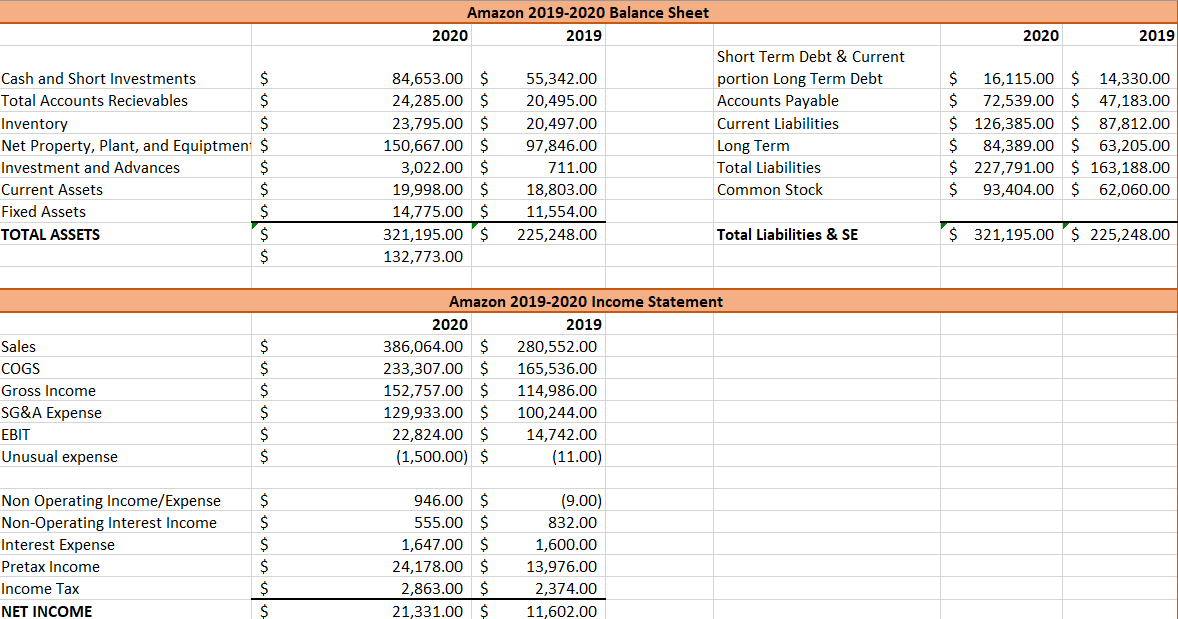
Pl
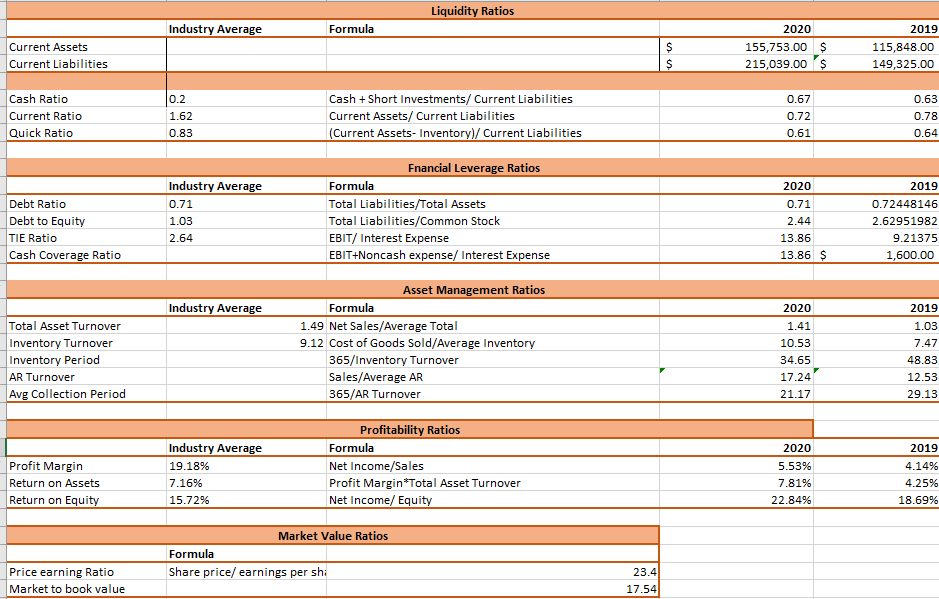
2020 2019 Cash and Short Investments $ Total Accounts Recievables $ Inventory $ Net Property, Plant, and Equiptmen $ Investment and Advances $ Current Assets $ Fixed Assets $ TOTAL ASSETS $ $ Amazon 2019-2020 Balance Sheet 2020 2019 Short Term Debt & Current 84,653.00 $ 55,342.00 portion Long Term Debt 24,285.00 $ 20,495.00 Accounts Payable 23,795.00 $ 20,497.00 Current Liabilities 150,667.00 $ 97,846.00 Long Term 3,022.00 $ 711.00 Total Liabilities 19,998.00 $ 18,803.00 Common Stock 14,775.00 $ 11,554.00 321,195.00 $ 225,248.00 Total Liabilities & SE 132,773.00 $ 16,115.00 $ 14,330.00 $ 72,539.00 $ 47,183.00 $ 126,385.00 $ 87,812.00 $ 84,389.00 $ 63,205.00 $ 227,791.00 $ 163,188.00 $ 93,404.00 $ 62,060.00 $ 321,195.00 $ 225,248.00 Sales COGS Gross Income SG&A Expense EBIT Unusual expense $ $ $ $ $ $ Amazon 2019-2020 Income Statement 2020 2019 386,064.00 $ 280,552.00 233,307.00 $ 165,536.00 152,757.00 $ 114,986.00 129,933.00 $ 100,244.00 22,824.00 $ 14,742.00 (1,500.00) $ (11.00) Non Operating Income/Expense Non-Operating Interest Income Interest Expense Pretax Income Income Tax NET INCOME $ $ $ $ 946.00 555.00 $ 1,647.00 $ 24,178.00 $ 2,863.00 $ 21,331.00 $ (9.00) 832.00 1,600.00 13,976.00 2,374.00 11,602.00 $ Liquidity Ratios Industry Average Formula Current Assets Current Liabilities S $ 2020 155,753.00 $ 215,039.00 $ 2019 115,848.00 149,325.00 Cash Ratio Current Ratio Quick Ratio 0.2 1.62 0.83 Cash + Short Investments/ Current Liabilities Current Assets/ Current Liabilities (Current Assets- Inventory)/ Current Liabilities 0.67 0.72 0.61 0.63 0.78 0.64 2019 Debt Ratio Debt to Equity TIE Ratio Cash Coverage Ratio Industry Average 0.71 1.03 2.64 Fnancial Leverage Ratios Formula Total Liabilities/Total Assets Total Liabilities/Common Stock EBIT/Interest Expense EBIT+Noncash expense/ Interest Expense 2020 0.71 2.44 13.86 13.86 $ 0.72448146 2.62951982 9.21375 1,600.00 Industry Average 2019 Total Asset Turnover Inventory Turnover Inventory Period AR Turnover Avg Collection Period Asset Management Ratios Formula 1.49 Net Sales/Average Total 9.12 Cost of Goods Sold/Average Inventory 365/Inventory Turnover Sales/Average AR 365/AR Turnover 2020 1.41 10.53 34.65 17.24 21.17 1.03 7.47 48.83 12.53 29.13 2019 Profit Margin Return on Assets Return on Equity Industry Average 19.18% 7.16% 15.72% Profitability Ratios Formula Net Income/Sales Profit Margin*Total Asset Turnover Net Income/ Equity 2020 5.53% 7.81% 22.84% 4.14% 4.25% 18.69% Market Value Ratios Formula Share price/ earnings per shi Price earning Ratio Market to book value 23.4 17.54 2020 2019 Cash and Short Investments $ Total Accounts Recievables $ Inventory $ Net Property, Plant, and Equiptmen $ Investment and Advances $ Current Assets $ Fixed Assets $ TOTAL ASSETS $ $ Amazon 2019-2020 Balance Sheet 2020 2019 Short Term Debt & Current 84,653.00 $ 55,342.00 portion Long Term Debt 24,285.00 $ 20,495.00 Accounts Payable 23,795.00 $ 20,497.00 Current Liabilities 150,667.00 $ 97,846.00 Long Term 3,022.00 $ 711.00 Total Liabilities 19,998.00 $ 18,803.00 Common Stock 14,775.00 $ 11,554.00 321,195.00 $ 225,248.00 Total Liabilities & SE 132,773.00 $ 16,115.00 $ 14,330.00 $ 72,539.00 $ 47,183.00 $ 126,385.00 $ 87,812.00 $ 84,389.00 $ 63,205.00 $ 227,791.00 $ 163,188.00 $ 93,404.00 $ 62,060.00 $ 321,195.00 $ 225,248.00 Sales COGS Gross Income SG&A Expense EBIT Unusual expense $ $ $ $ $ $ Amazon 2019-2020 Income Statement 2020 2019 386,064.00 $ 280,552.00 233,307.00 $ 165,536.00 152,757.00 $ 114,986.00 129,933.00 $ 100,244.00 22,824.00 $ 14,742.00 (1,500.00) $ (11.00) Non Operating Income/Expense Non-Operating Interest Income Interest Expense Pretax Income Income Tax NET INCOME $ $ $ $ 946.00 555.00 $ 1,647.00 $ 24,178.00 $ 2,863.00 $ 21,331.00 $ (9.00) 832.00 1,600.00 13,976.00 2,374.00 11,602.00 $ Liquidity Ratios Industry Average Formula Current Assets Current Liabilities S $ 2020 155,753.00 $ 215,039.00 $ 2019 115,848.00 149,325.00 Cash Ratio Current Ratio Quick Ratio 0.2 1.62 0.83 Cash + Short Investments/ Current Liabilities Current Assets/ Current Liabilities (Current Assets- Inventory)/ Current Liabilities 0.67 0.72 0.61 0.63 0.78 0.64 2019 Debt Ratio Debt to Equity TIE Ratio Cash Coverage Ratio Industry Average 0.71 1.03 2.64 Fnancial Leverage Ratios Formula Total Liabilities/Total Assets Total Liabilities/Common Stock EBIT/Interest Expense EBIT+Noncash expense/ Interest Expense 2020 0.71 2.44 13.86 13.86 $ 0.72448146 2.62951982 9.21375 1,600.00 Industry Average 2019 Total Asset Turnover Inventory Turnover Inventory Period AR Turnover Avg Collection Period Asset Management Ratios Formula 1.49 Net Sales/Average Total 9.12 Cost of Goods Sold/Average Inventory 365/Inventory Turnover Sales/Average AR 365/AR Turnover 2020 1.41 10.53 34.65 17.24 21.17 1.03 7.47 48.83 12.53 29.13 2019 Profit Margin Return on Assets Return on Equity Industry Average 19.18% 7.16% 15.72% Profitability Ratios Formula Net Income/Sales Profit Margin*Total Asset Turnover Net Income/ Equity 2020 5.53% 7.81% 22.84% 4.14% 4.25% 18.69% Market Value Ratios Formula Share price/ earnings per shi Price earning Ratio Market to book value 23.4 17.54
Step by Step Solution
There are 3 Steps involved in it

Get step-by-step solutions from verified subject matter experts