

Question: Please help, will upvote! A B D E F G H I M N 59 EXHIBIT: RELATIONSHIP BETWEEN UTILIZATION AND FORD EPS EXHIBIT: RELATIONSHIP BETWEEN
Please help, will upvote!
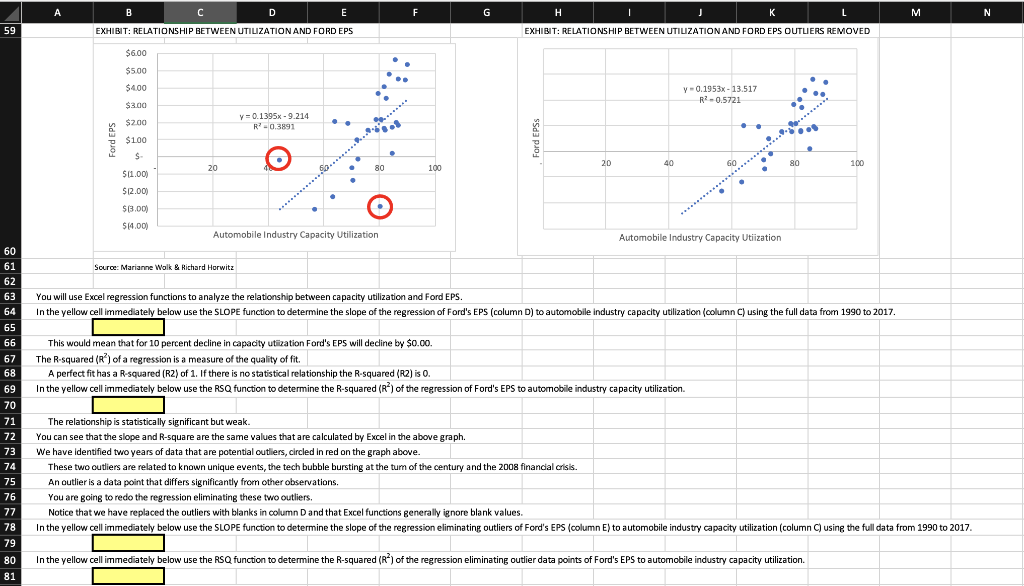
A B D E F G H I M N 59 EXHIBIT: RELATIONSHIP BETWEEN UTILIZATION AND FORD EPS EXHIBIT: RELATIONSHIP BETWEEN UTILIZATION AND FORD EPS OUTLIERS REMOVED $6.00 $500 $4.00 Y-0.1953x - 13.517 R2 -0.5721 $3.00 $200 y = 0.1395 - 9.214 R? -0.3891 Ford EPS . $100 $ S 20 40 GO 80 100 20 80 100 $11.00) $12.00) $13.00) $14.00) Automobile Industry Capacity Utilization Automobile Industry Capacity Utiization 60 61 Source: Marianne Wolk & Richard Horwitz 62 63 64 04 65 66 You will use Excel regression functions to analyze the relationship between capacity utilization and Ford EPS. In the yellow cell immediately below use the SLOPE function to determine the slope of the regression of Ford's EPS (column D) to automobile industry capacity utilization (column C) using the full data from 1990 to 2017. 67 This would mean that for 10 percent decline in capacity utilization Ford's EPS will dedine by $0.00 The R-squared (R) of a regression is a measure of the quality of fit. A perfect fit has a R-squared (R2) of 1. If there is no statistical relationship the R-squared (R2) is 0. In the yellow cell immediately below use the RSQ function to determine the R-squared (R) of the regression of Ford's EPS to automobile industry capacity utilization 68 69 70 71 72 73 74 75 The relationship is statistically significant but weak. You can see that the slope and R-square are the same values that are calculated by Excel in the above graph. We have identified two years of data that are potential outliers, circled in red on the graph above. These two outliers are related to known unique events, the tech bubble bursting at the tum of the century and the 2008 financial crisis. An outlier is a data point that differs significantly from other observations. You are going to redo the regression eliminating these two outliers. Notice that we have replaced the outliers with blanks in column Dand that Excel functions generally ignore blank values In the yellow cell immediately below use the SLOPE function to determine the slope of the regression eliminating outliers of Ford's EPS (column E) to automobile industry capacity utilization (column C) using the full data from 1990 to 2017. 76 77 78 79 80 81 In the yellow cell immediately below use the RSQ function to determine the R-squared (R) of the regression eliminating outlier data points of Ford's EPS to automobile industry capacity utilization. A B D E F G H I M N 59 EXHIBIT: RELATIONSHIP BETWEEN UTILIZATION AND FORD EPS EXHIBIT: RELATIONSHIP BETWEEN UTILIZATION AND FORD EPS OUTLIERS REMOVED $6.00 $500 $4.00 Y-0.1953x - 13.517 R2 -0.5721 $3.00 $200 y = 0.1395 - 9.214 R? -0.3891 Ford EPS . $100 $ S 20 40 GO 80 100 20 80 100 $11.00) $12.00) $13.00) $14.00) Automobile Industry Capacity Utilization Automobile Industry Capacity Utiization 60 61 Source: Marianne Wolk & Richard Horwitz 62 63 64 04 65 66 You will use Excel regression functions to analyze the relationship between capacity utilization and Ford EPS. In the yellow cell immediately below use the SLOPE function to determine the slope of the regression of Ford's EPS (column D) to automobile industry capacity utilization (column C) using the full data from 1990 to 2017. 67 This would mean that for 10 percent decline in capacity utilization Ford's EPS will dedine by $0.00 The R-squared (R) of a regression is a measure of the quality of fit. A perfect fit has a R-squared (R2) of 1. If there is no statistical relationship the R-squared (R2) is 0. In the yellow cell immediately below use the RSQ function to determine the R-squared (R) of the regression of Ford's EPS to automobile industry capacity utilization 68 69 70 71 72 73 74 75 The relationship is statistically significant but weak. You can see that the slope and R-square are the same values that are calculated by Excel in the above graph. We have identified two years of data that are potential outliers, circled in red on the graph above. These two outliers are related to known unique events, the tech bubble bursting at the tum of the century and the 2008 financial crisis. An outlier is a data point that differs significantly from other observations. You are going to redo the regression eliminating these two outliers. Notice that we have replaced the outliers with blanks in column Dand that Excel functions generally ignore blank values In the yellow cell immediately below use the SLOPE function to determine the slope of the regression eliminating outliers of Ford's EPS (column E) to automobile industry capacity utilization (column C) using the full data from 1990 to 2017. 76 77 78 79 80 81 In the yellow cell immediately below use the RSQ function to determine the R-squared (R) of the regression eliminating outlier data points of Ford's EPS to automobile industry capacity utilization
Step by Step Solution
There are 3 Steps involved in it

Get step-by-step solutions from verified subject matter experts