

Question: A B D E F G H K L M N Please find the question below and complete the worksheets titled - Ratio&CF, 'CmnsizeV', 'CmnsizeH',
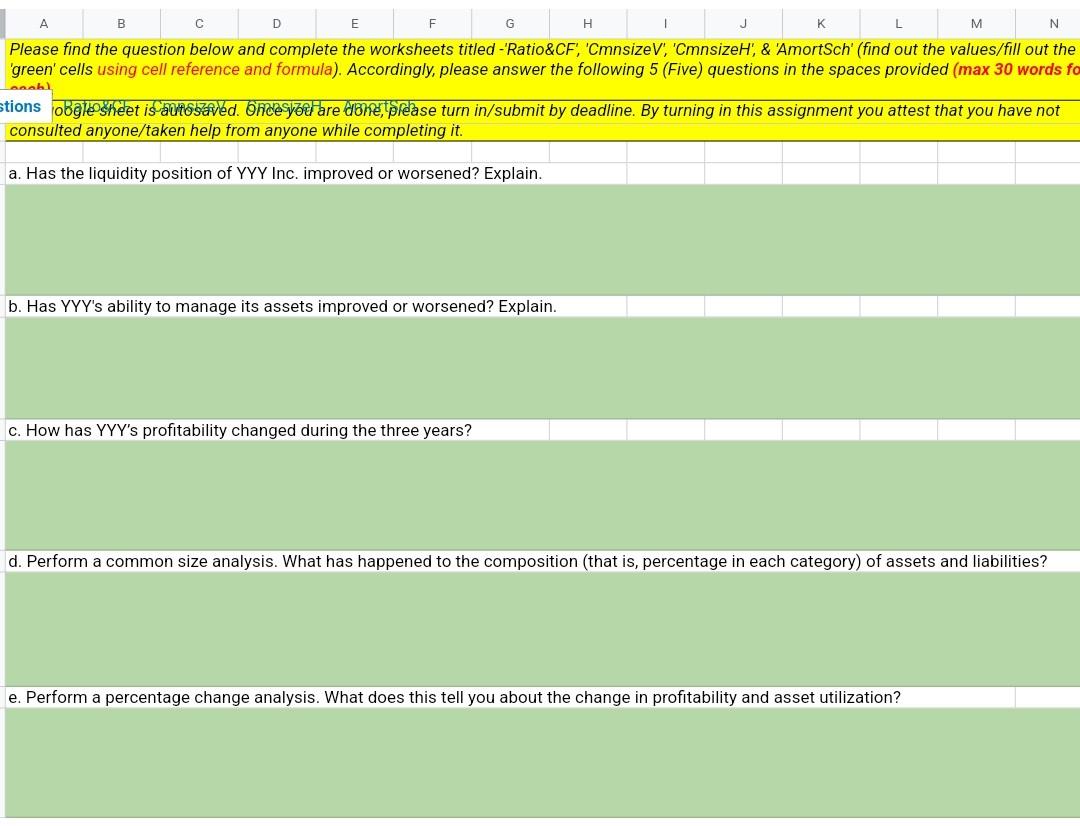
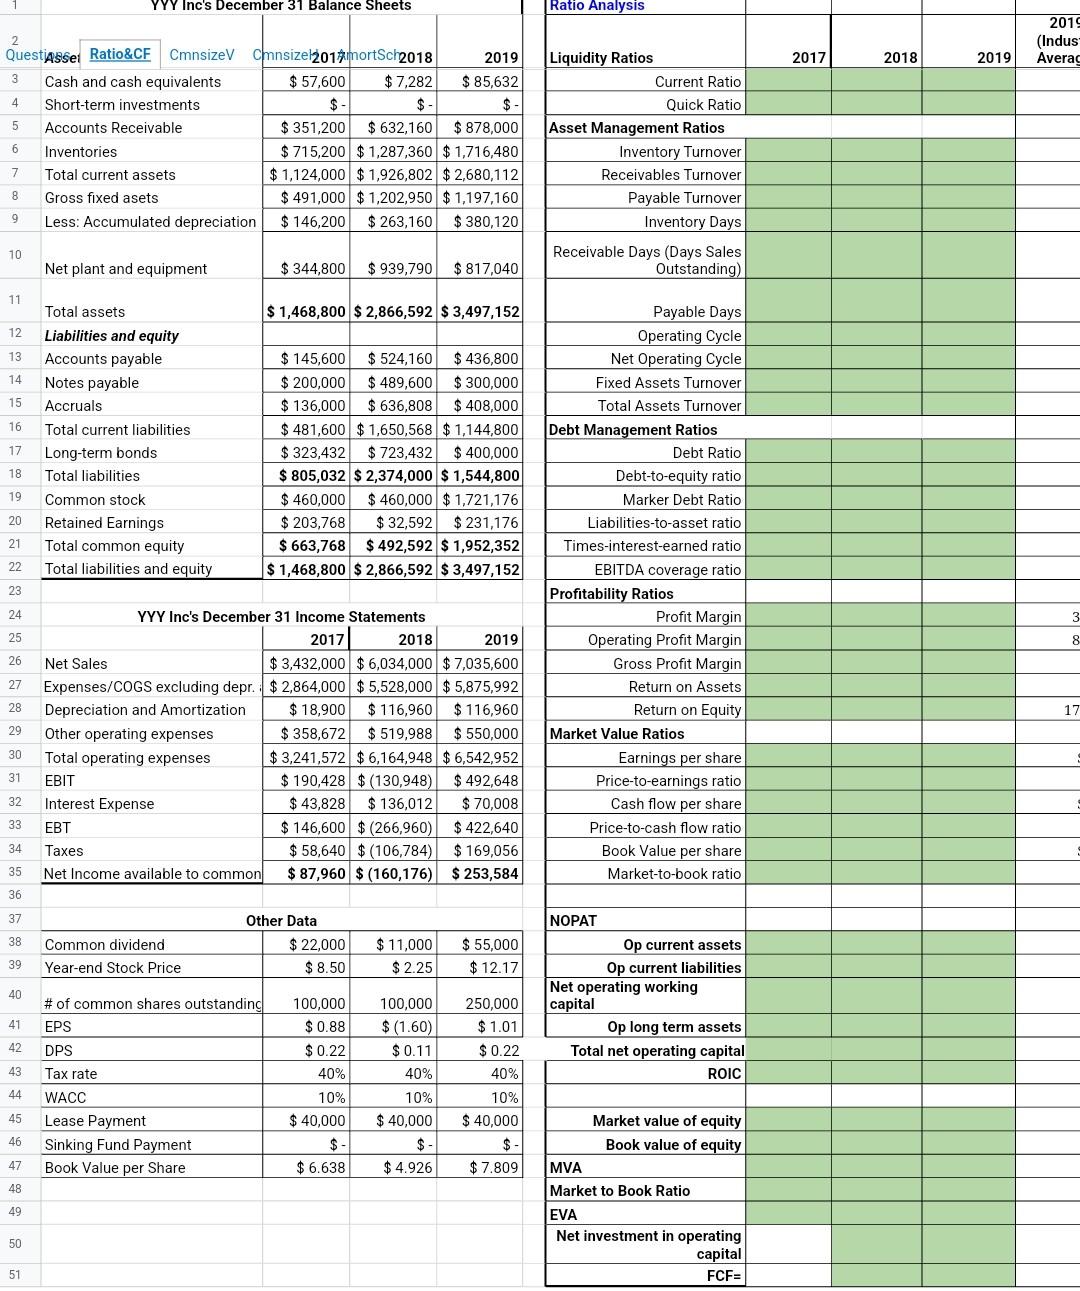
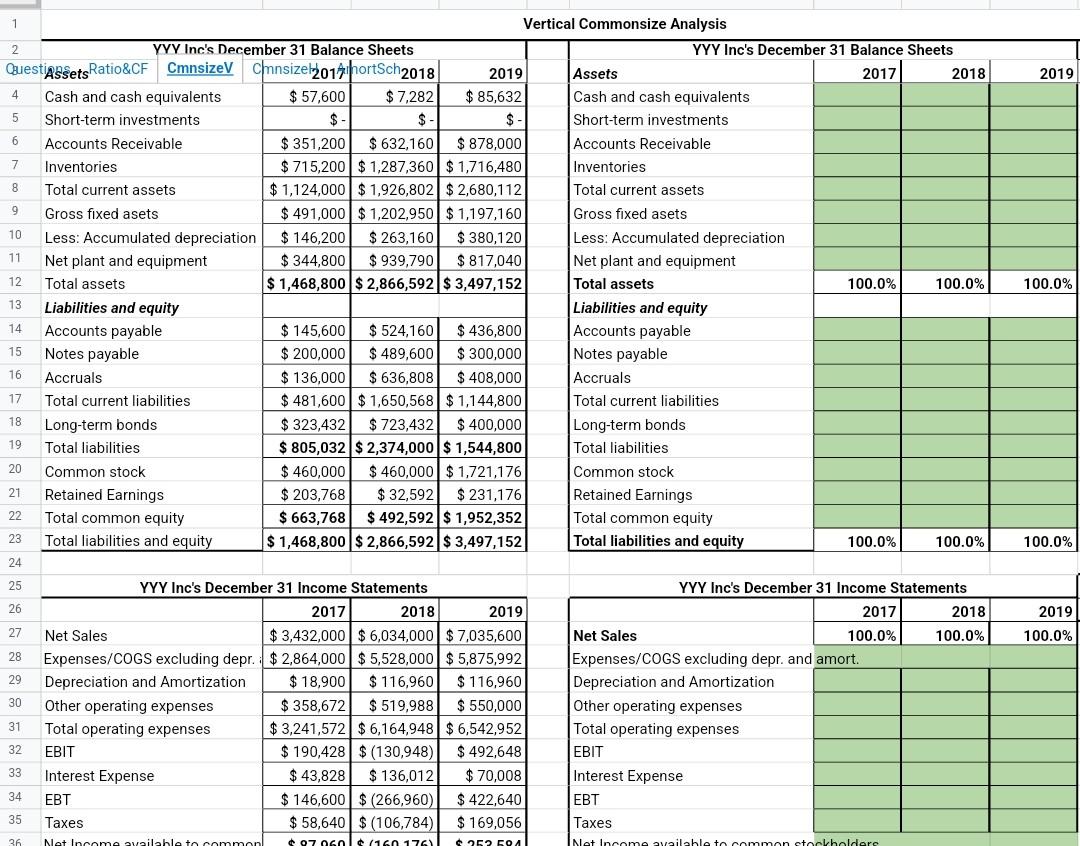
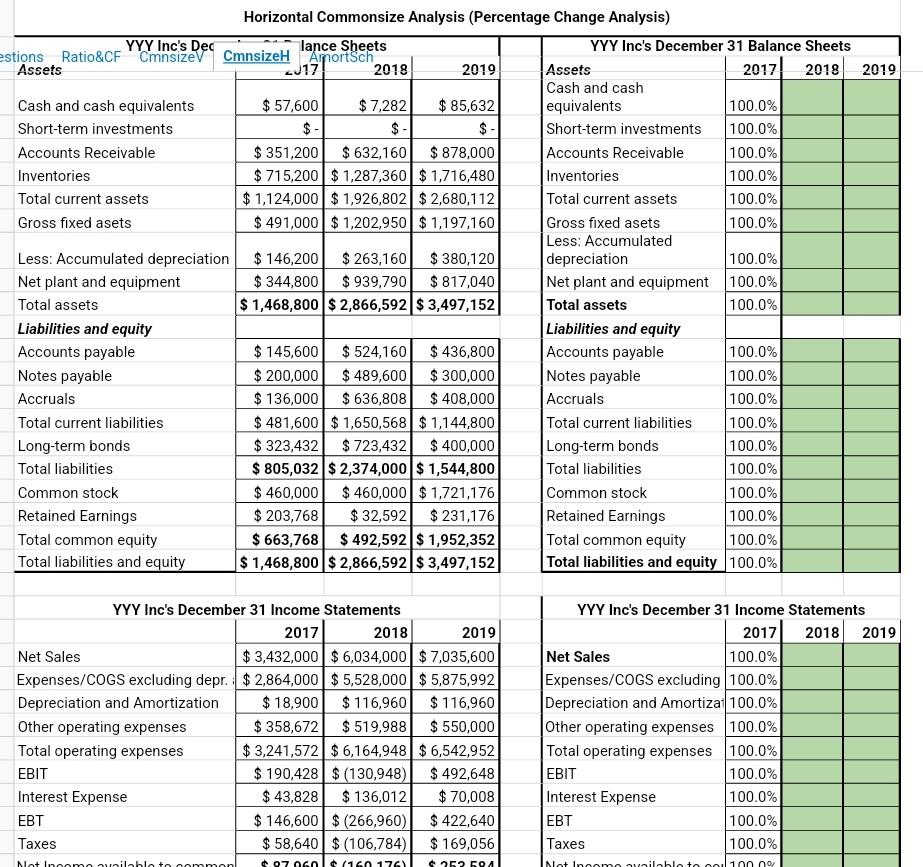
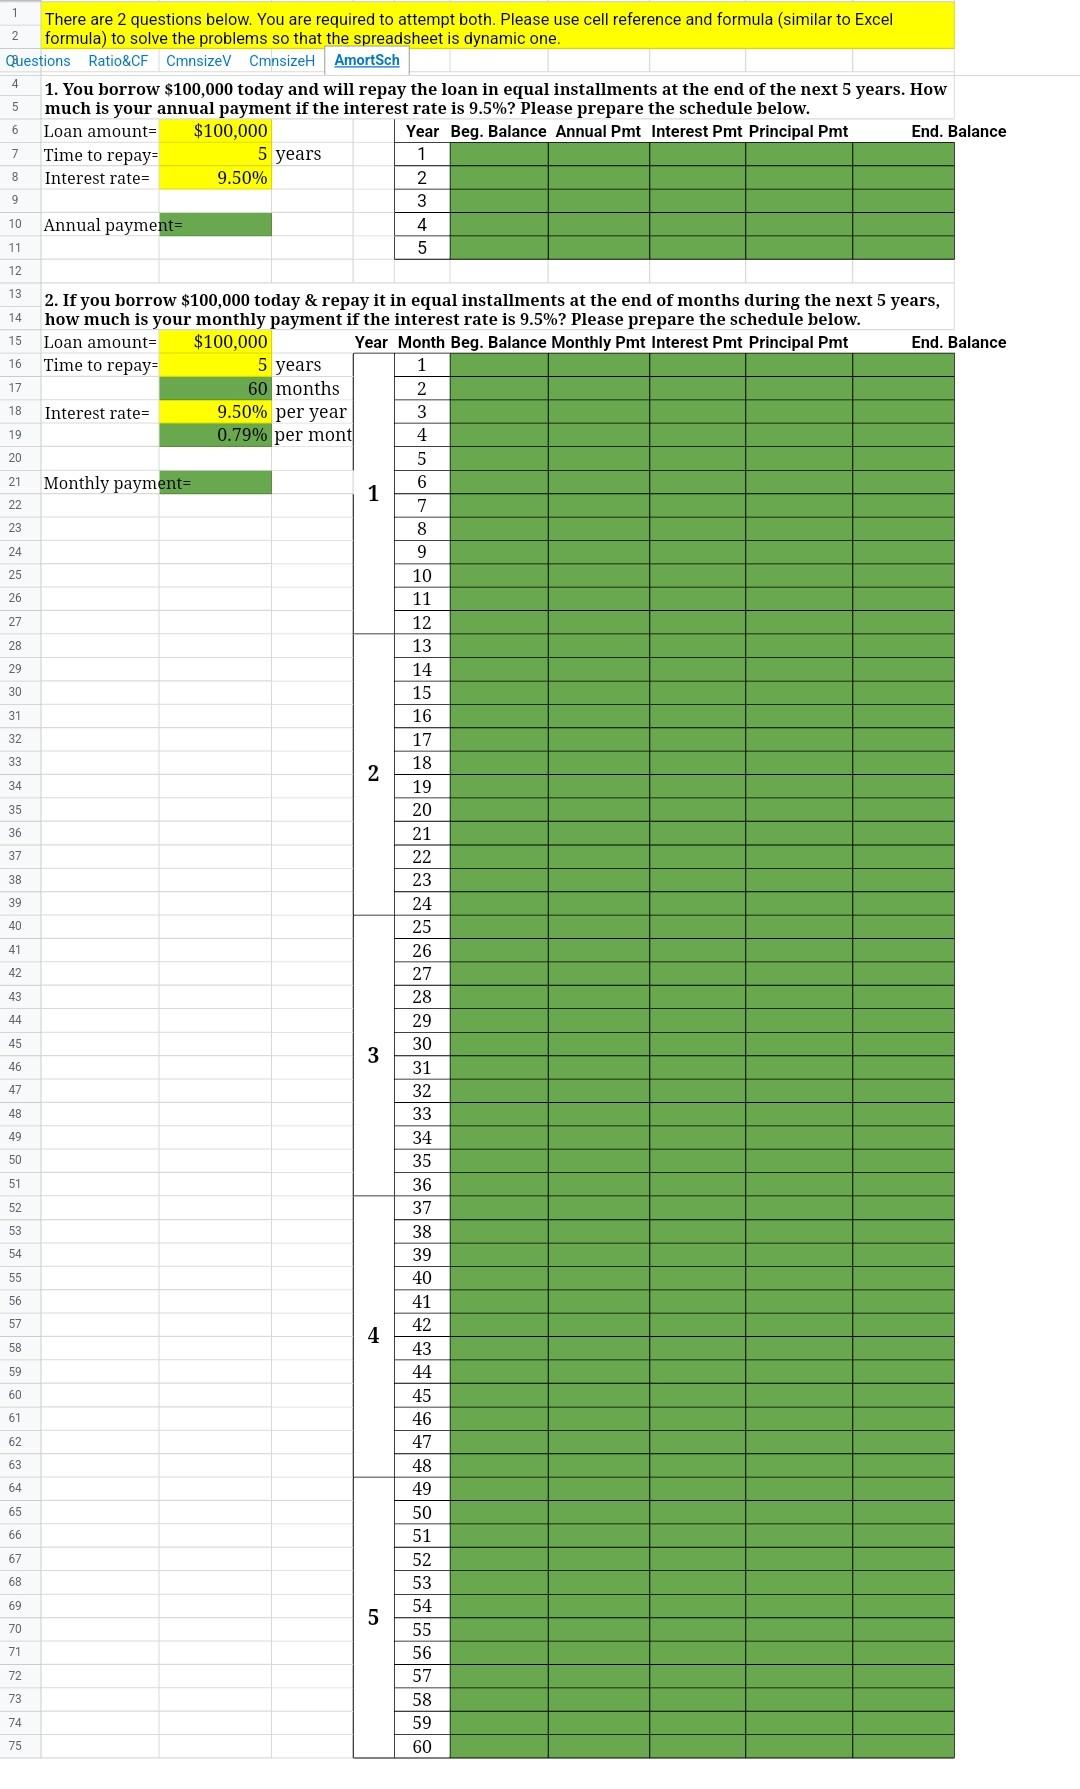
A B D E F G H K L M N Please find the question below and complete the worksheets titled - Ratio&CF, 'CmnsizeV', 'CmnsizeH', & AmortSch' (find out the values/fill out the 'green' cells using cell reference and formula). Accordingly, please answer the following 5 (Five) questions in the spaces provided (max 30 words fo Lanab stions obale sheet is autosaved. Once you are done, please turn in/submit by deadline. By turning in this assignment you attest that you have not consulted anyone/taken help from anyone while completing it a. Has the liquidity position of YYY Inc. improved or worsened? Explain. b. Has YYY's ability to manage its assets improved or worsened? Explain. c. How has YYY's profitability changed during the three years? d. Perform a common size analysis. What has happened to the composition (that is, percentage in each category) of assets and liabilities? e. Perform a percentage change analysis. What does this tell you about the change in profitability and asset utilization? YYY Inc's December 31 Balance Sheets | Ratio Analysis 2019 (Indus Averac 2017 2018 2019 3 4 2 QuestAsset Ratio&CF CmnsizeV Cinsize 2014mortSch2018 2019 Cash and cash equivalents $ 57,600 $ 7,282 $ 85,632 Short-term investments $- $- $- 5 Accounts Receivable $ 351,200 $ 632,160 $ 878,000 6 Inventories $ 715,200 $1,287,360 $1,716,480 7 Total current assets $ 1,124,000 $1,926,802 $2,680,112 Gross fixed asets $ 491,000 $1,202,950 $ 1,197,160 Less: Accumulated depreciation $ 146,200 $ 263,160 $ 380,120 Liquidity Ratios Current Ratio Quick Ratio Asset Management Ratios Inventory Turnover Receivables Turnover Payable Turnover Inventory Days Receivable Days (Days Sales Outstanding) 8 9 10 Net plant and equipment $ 344,800 $939,790 $ 817,040 11 $ 1,468,800 $ 2,866,592 $ 3,497,152 12 13 14 15 16 Total assets Liabilities and equity Accounts payable Notes payable Accruals Total current liabilities Long-term bonds Total liabilities Common stock Retained Earnings Total common equity Total liabilities and equity 17 $ 145,600 $ 524,160 $ 436,800 $ 200,000 $ 489,600 $ 300,000 $ 136,000 $636,808 $ 408,000 $ 481,600 $ 1,650,568 $ 1,144,800 $ 323,432 $ 723,432 $ 400,000 $ 805,032 $ 2,374,000 $ 1,544,800 $ 460,000 $ 460,000 $1,721,176 $ 203,768 $ 32,592 $ 231,176 $ 663,768 $ 492,592 $ 1,952,352 $ 1,468,800 $ 2,866,592 $ 3,497,152 18 19 20 21 22 23 Payable Days Operating Cycle Net Operating Cycle Fixed Assets Turnover Total Assets Turnover Debt Management Ratios Debt Ratio Debt-to-equity ratio Marker Debt Ratio Liabilities-to-asset ratio Times-interest-earned ratio EBITDA coverage ratio Profitability Ratios Profit Margin Operating Profit Margin Gross Profit Margin Return on Assets Return on Equity Market Value Ratios Earnings per share Price-to-earnings ratio Cash flow per share Price-to-cash flow ratio Book Value per share Market-to-book ratio 24 3 3 8 25 26 27 28 17 29 YYY Inc's December 31 Income Statements 2017 2018 2019 Net Sales $ 3,432,000 $6,034,000 $7,035,600 Expenses/COGS excluding depr. $ 2,864,000 $5,528,000 $5,875,992 Depreciation and Amortization $ 18,900 $ 116,960 $ 116,960 Other operating expenses $ 358,672 $ 519,988 $ 550,000 Total operating expenses $ 3,241,572 $ 6,164,948 $6,542,952 EBIT $ 190,428 $ (130,948) $ 492,648 Interest Expense $ 43,828 $ 136,012 $ 70,008 EBT $ 146,600 $ (266,960) $ 422,640 Taxes $ 58,640 $ (106,784) $ 169,056 Net Income available to common $ 87,960 $ (160,176) $ 253,584 30 31 32 33 34 35 36 37 38 Common dividend Year-end Stock Price Other Data $ 22,000 $8.50 $11,000 $ 2.25 $ 55,000 $ 12.17 39 40 # of common shares outstanding EPS NOPAT Op current assets Op current liabilities Net operating working capital Op long term assets Total net operating capital ROIC 100,000 $ 0.88 $ 0.22 40% 41 42 43 100,000 $ (1.60) $ 0.11 40% 10% $ 40,000 $- $ 4.926 DPS Tax rate WACC Lease Payment Sinking Fund Payment Book Value per Share 250,000 $ 1.01 $ 0.22 40% 10% $ 40,000 $- $ 7.809 44 45 10% $ 40,000 $- $ 6.638 46 47 48 Market value of equity Book value of equity MVA Market to Book Ratio EVA Net investment in operating capital FCF- 49 50 51 2019 100.0% 1 Vertical Commonsize Analysis 2 YYY Inc's December 31 Balance Sheets YYY Inc's December 31 Balance Sheets Quest'Assets Ratio&CF CmnsizeV Cinsizel2017 hortSch 2018 2019 Assets 2017 2018 4 Cash and cash equivalents $ 57,600 $ 7,282 $ 85,632 Cash and cash equivalents 5 Short-term investments $ - $ Short-term investments 6 Accounts Receivable $ 351,200 $ 632,160 $ 878,000 Accounts Receivable 7 Inventories $ 715,200 $ 1,287,360 $ 1,716,480 Inventories 8 Total current assets $ 1,124,000 $1,926,802 $ 2,680,112 Total current assets 9 Gross fixed asets $ 491,000 $ 1,202,950 $ 1,197,160 Gross fixed asets 10 Less: Accumulated depreciation $ 146,200 $ 263,160 $ 380,120 Less: Accumulated depreciation 11 Net plant and equipment $ 344,800 $ 939,790 $ 817,040 Net plant and equipment 12 Total assets $ 1,468,800 $ 2,866,592 $ 3,497,152 Total assets 100.0% 100.0% 13 Liabilities and equity Liabilities and equity 14 Accounts payable $ 145,600 $ 524,160 $ 436,800 Accounts payable 15 Notes payable $ 200,000 $ 489,600 $ 300,000 Notes payable 16 Accruals $ 136,000 $636,808 $ 408,000 Accruals 17 Total current liabilities $ 481,600 $ 1,650,568 $ 1,144,800 Total current liabilities 18 Long-term bonds $ 323,432 $ 723,432 $ 400,000 Long-term bonds 19 Total liabilities $ 805,032 $ 2,374,000 $ 1,544,800 Total liabilities 20 Common stock $ 460,000 $ 460,000 $1,721,176 Common stock 21 Retained Earnings $ 203,768 $ 32,592 $ 231,176 Retained Earnings 22 Total common equity $ 663,768 $ 492,592 $ 1,952,352 Total common equity 23 Total liabilities and equity $ 1,468,800 $ 2,866,592 $ 3,497,152 Total liabilities and equity 100.0% 100.0% 24 25 YYY Inc's December 31 Income Statements YYY Inc's December 31 Income Statements 26 2017 2018 2019 2018 27 Net Sales $ 3,432,000 $6,034,000 $7,035,600 Net Sales 100.0% 100.0% 28 Expenses/COGS excluding depr. $ 2,864,000 $ 5,528,000 $5,875,992 Expenses/COGS excluding depr. and amort. 29 Depreciation and Amortization $ 18,900 $ 116,960 $ 116,960 Depreciation and Amortization 30 Other operating expenses $ 358,672 $ 519,988 $ 550,000 Other operating expenses 31 Total operating expenses $ 3,241,572 $ 6,164,948 $6,542,952 Total operating expenses 32 EBIT $ 190,428 $ (130,948) $ 492,648 EBIT 33 Interest Expense $ 43,828 $ 136,012 $ 70,008 Interest Expense 34 EBT $ 146,600 $ (266,960) $ 422,640 EBT 35 Taxes $ 58,640 $ (106,784) $ 169,056 Taxes 36 Net Income available to common 97060(160 1761 $252594 100.0% 2017 2019 100.0% Net Income available to common stockholders 2019 Horizontal Commonsize Analysis (Percentage Change Analysis) YYY Inc's Dec lance Sheets YYY Inc's December 31 Balance Sheets estions Ratio&CF Cmnsizev CmnsizeH Aportsch Assets 2017 2018 2019 Assets 2017 2018 Cash and cash Cash and cash equivalents $ 57,600 $ 7,282 $ 85,632 equivalents 100.0% Short-term investments $ - $- Short-term investments 100.0% Accounts Receivable $ 351,200 $632,160 $ 878,000 Accounts Receivable 100.0% Inventories $ 715,200 $ 1,287,360 $ 1,716,480 Inventories 100.0% Total current assets $ 1,124,000 $ 1,926,802 $ 2,680,112 Total current assets 100.0% Gross fixed asets $ 491,000 $ 1,202,950 $ 1,197,160 Gross fixed asets 100.0% Less: Accumulated Less: Accumulated depreciation $ 146,200 $ 263,160 $ 380,120 depreciation 100.0% Net plant and equipment $ 344,800 $ 939,790 $ 817,040 Net plant and equipment 100.0% Total assets $ 1,468,800 $ 2,866,592 $ 3,497,152 Total assets 100.0% Liabilities and equity Liabilities and equity Accounts payable $ 145,600 $ 524,160 $ 436,800 Accounts payable 100.0% Notes payable $ 200,000 $ 489,600 $ 300,000 Notes payable 100.0% Accruals $ 136,000 $636,808 $ 408,000 Accruals 100.0% Total current liabilities $ 481,600 $ 1,650,568 $ 1,144,800 Total current liabilities 100.0% Long-term bonds $ 323,432 $ 723,432 $ 400,000 Long-term bonds 100.0% Total liabilities $ 805,032 $ 2,374,000 $ 1,544,800 Total liabilities 100.0% Common stock $ 460,000 $ 460,000 $1,721,176 Common stock 100.0% Retained Earnings $ 203,768 $ 32,592 $ 231,176 Retained Earnings 100.0% Total common equity $ 663,768 $ 492,592 $ 1,952,352 Total common equity 100.0% Total liabilities and equity $ 1,468,800 $ 2,866,592 $ 3,497,152 Total liabilities and equity 100.0% YYY Inc's December 31 Income Statements 2017 2018 2019 Net Sales $ 3,432,000 $6,034,000 $ 7,035,600 Expenses/COGS excluding depr.: $ 2,864,000 $ 5,528,000 $5,875,992 Depreciation and Amortization $ 18,900 $ 116,960 $ 116,960 Other operating expenses $ 358,672 $ 519,988 $ 550,000 Total operating expenses $3,241,572 $ 6,164,948 $ 6,542,952 EBIT $ 190,428 $ (130,948) $ 492,648 Interest Expense $ 43,828 $ 136,012 $ 70,008 EBT $ 146,600 $ (266,960) $ 422,640 Taxes $ 58,640 $ (106,784) $ 169,056 $97.000 (160 1761 YYY Inc's December 31 Income Statements 2017 2018 2019 Net Sales 100.0% Expenses/COGS excluding 100.0% Depreciation and Amortiza 100.0% Other operating expenses 100.0% Total operating expenses 100.0% EBIT 100.0% Interest Expense 100.0% EBT 100.0% Taxes 100.0% Not Incoma unilable to common 252 50 A Not Income ilable to call on noy 1 2 4 5 There are 2 questions below. You are required to attempt both. Please use cell reference and formula (similar to Excel formula) to solve the problems so that the spreadsheet is dynamic one. Questions Ratio&CF CmnsizeV Cmnsizel AmortSch 1. You borrow $100,000 today and will repay the loan in equal installments at the end of the next 5 years. How much is your annual payment if the interest rate is 9.5%? Please prepare the schedule below. Loan amount= $100,000 Year Beg. Balance Annual Pmt Interest Pmt Principal Pmt End. Balance Time to repay- 1 8 Interest rate= 9.50% 2 3 Annual payment 4 11 5 6 7 5 years 9 10 12 13 14 15 16 17 2. If you borrow $100,000 today & repay it in equal installments at the end of months during the next 5 years, how much is your monthly payment if the interest rate is 9.5%? Please prepare the schedule below. Loan amount= $100,000 Year Month Beg. Balance Monthly Pmt Interest Pmt Principal Pmt End. Balance Time to repay 5 years 1 60 months 2 Interest rate= 9.50% per year 3 0.79% per mont 4 5 Monthly payment 6 7 18 19 20 21 1 22 23 8 9 24 25 10 11 26 27 28 29 30 31 32 33 2 34 35 36 37 38 39 40 | 41 42 43 44 45 3 3 46 M 47 48 49 50 51 12 13 14 15 16 17 18 19 20 21 22 23 24 25 26 27 28 29 30 31 32 33 34 35 36 37 38 39 40 41 42 43 44 45 46 47 48 49 50 51 52 53 54 55 56 57 58 59 60 52 53 54 55 56 57 4 58 59 60 61 62 63 64 65 66 67 68 69 5 70 71 72 74 75 A B D E F G H K L M N Please find the question below and complete the worksheets titled - Ratio&CF, 'CmnsizeV', 'CmnsizeH', & AmortSch' (find out the values/fill out the 'green' cells using cell reference and formula). Accordingly, please answer the following 5 (Five) questions in the spaces provided (max 30 words fo Lanab stions obale sheet is autosaved. Once you are done, please turn in/submit by deadline. By turning in this assignment you attest that you have not consulted anyone/taken help from anyone while completing it a. Has the liquidity position of YYY Inc. improved or worsened? Explain. b. Has YYY's ability to manage its assets improved or worsened? Explain. c. How has YYY's profitability changed during the three years? d. Perform a common size analysis. What has happened to the composition (that is, percentage in each category) of assets and liabilities? e. Perform a percentage change analysis. What does this tell you about the change in profitability and asset utilization? YYY Inc's December 31 Balance Sheets | Ratio Analysis 2019 (Indus Averac 2017 2018 2019 3 4 2 QuestAsset Ratio&CF CmnsizeV Cinsize 2014mortSch2018 2019 Cash and cash equivalents $ 57,600 $ 7,282 $ 85,632 Short-term investments $- $- $- 5 Accounts Receivable $ 351,200 $ 632,160 $ 878,000 6 Inventories $ 715,200 $1,287,360 $1,716,480 7 Total current assets $ 1,124,000 $1,926,802 $2,680,112 Gross fixed asets $ 491,000 $1,202,950 $ 1,197,160 Less: Accumulated depreciation $ 146,200 $ 263,160 $ 380,120 Liquidity Ratios Current Ratio Quick Ratio Asset Management Ratios Inventory Turnover Receivables Turnover Payable Turnover Inventory Days Receivable Days (Days Sales Outstanding) 8 9 10 Net plant and equipment $ 344,800 $939,790 $ 817,040 11 $ 1,468,800 $ 2,866,592 $ 3,497,152 12 13 14 15 16 Total assets Liabilities and equity Accounts payable Notes payable Accruals Total current liabilities Long-term bonds Total liabilities Common stock Retained Earnings Total common equity Total liabilities and equity 17 $ 145,600 $ 524,160 $ 436,800 $ 200,000 $ 489,600 $ 300,000 $ 136,000 $636,808 $ 408,000 $ 481,600 $ 1,650,568 $ 1,144,800 $ 323,432 $ 723,432 $ 400,000 $ 805,032 $ 2,374,000 $ 1,544,800 $ 460,000 $ 460,000 $1,721,176 $ 203,768 $ 32,592 $ 231,176 $ 663,768 $ 492,592 $ 1,952,352 $ 1,468,800 $ 2,866,592 $ 3,497,152 18 19 20 21 22 23 Payable Days Operating Cycle Net Operating Cycle Fixed Assets Turnover Total Assets Turnover Debt Management Ratios Debt Ratio Debt-to-equity ratio Marker Debt Ratio Liabilities-to-asset ratio Times-interest-earned ratio EBITDA coverage ratio Profitability Ratios Profit Margin Operating Profit Margin Gross Profit Margin Return on Assets Return on Equity Market Value Ratios Earnings per share Price-to-earnings ratio Cash flow per share Price-to-cash flow ratio Book Value per share Market-to-book ratio 24 3 3 8 25 26 27 28 17 29 YYY Inc's December 31 Income Statements 2017 2018 2019 Net Sales $ 3,432,000 $6,034,000 $7,035,600 Expenses/COGS excluding depr. $ 2,864,000 $5,528,000 $5,875,992 Depreciation and Amortization $ 18,900 $ 116,960 $ 116,960 Other operating expenses $ 358,672 $ 519,988 $ 550,000 Total operating expenses $ 3,241,572 $ 6,164,948 $6,542,952 EBIT $ 190,428 $ (130,948) $ 492,648 Interest Expense $ 43,828 $ 136,012 $ 70,008 EBT $ 146,600 $ (266,960) $ 422,640 Taxes $ 58,640 $ (106,784) $ 169,056 Net Income available to common $ 87,960 $ (160,176) $ 253,584 30 31 32 33 34 35 36 37 38 Common dividend Year-end Stock Price Other Data $ 22,000 $8.50 $11,000 $ 2.25 $ 55,000 $ 12.17 39 40 # of common shares outstanding EPS NOPAT Op current assets Op current liabilities Net operating working capital Op long term assets Total net operating capital ROIC 100,000 $ 0.88 $ 0.22 40% 41 42 43 100,000 $ (1.60) $ 0.11 40% 10% $ 40,000 $- $ 4.926 DPS Tax rate WACC Lease Payment Sinking Fund Payment Book Value per Share 250,000 $ 1.01 $ 0.22 40% 10% $ 40,000 $- $ 7.809 44 45 10% $ 40,000 $- $ 6.638 46 47 48 Market value of equity Book value of equity MVA Market to Book Ratio EVA Net investment in operating capital FCF- 49 50 51 2019 100.0% 1 Vertical Commonsize Analysis 2 YYY Inc's December 31 Balance Sheets YYY Inc's December 31 Balance Sheets Quest'Assets Ratio&CF CmnsizeV Cinsizel2017 hortSch 2018 2019 Assets 2017 2018 4 Cash and cash equivalents $ 57,600 $ 7,282 $ 85,632 Cash and cash equivalents 5 Short-term investments $ - $ Short-term investments 6 Accounts Receivable $ 351,200 $ 632,160 $ 878,000 Accounts Receivable 7 Inventories $ 715,200 $ 1,287,360 $ 1,716,480 Inventories 8 Total current assets $ 1,124,000 $1,926,802 $ 2,680,112 Total current assets 9 Gross fixed asets $ 491,000 $ 1,202,950 $ 1,197,160 Gross fixed asets 10 Less: Accumulated depreciation $ 146,200 $ 263,160 $ 380,120 Less: Accumulated depreciation 11 Net plant and equipment $ 344,800 $ 939,790 $ 817,040 Net plant and equipment 12 Total assets $ 1,468,800 $ 2,866,592 $ 3,497,152 Total assets 100.0% 100.0% 13 Liabilities and equity Liabilities and equity 14 Accounts payable $ 145,600 $ 524,160 $ 436,800 Accounts payable 15 Notes payable $ 200,000 $ 489,600 $ 300,000 Notes payable 16 Accruals $ 136,000 $636,808 $ 408,000 Accruals 17 Total current liabilities $ 481,600 $ 1,650,568 $ 1,144,800 Total current liabilities 18 Long-term bonds $ 323,432 $ 723,432 $ 400,000 Long-term bonds 19 Total liabilities $ 805,032 $ 2,374,000 $ 1,544,800 Total liabilities 20 Common stock $ 460,000 $ 460,000 $1,721,176 Common stock 21 Retained Earnings $ 203,768 $ 32,592 $ 231,176 Retained Earnings 22 Total common equity $ 663,768 $ 492,592 $ 1,952,352 Total common equity 23 Total liabilities and equity $ 1,468,800 $ 2,866,592 $ 3,497,152 Total liabilities and equity 100.0% 100.0% 24 25 YYY Inc's December 31 Income Statements YYY Inc's December 31 Income Statements 26 2017 2018 2019 2018 27 Net Sales $ 3,432,000 $6,034,000 $7,035,600 Net Sales 100.0% 100.0% 28 Expenses/COGS excluding depr. $ 2,864,000 $ 5,528,000 $5,875,992 Expenses/COGS excluding depr. and amort. 29 Depreciation and Amortization $ 18,900 $ 116,960 $ 116,960 Depreciation and Amortization 30 Other operating expenses $ 358,672 $ 519,988 $ 550,000 Other operating expenses 31 Total operating expenses $ 3,241,572 $ 6,164,948 $6,542,952 Total operating expenses 32 EBIT $ 190,428 $ (130,948) $ 492,648 EBIT 33 Interest Expense $ 43,828 $ 136,012 $ 70,008 Interest Expense 34 EBT $ 146,600 $ (266,960) $ 422,640 EBT 35 Taxes $ 58,640 $ (106,784) $ 169,056 Taxes 36 Net Income available to common 97060(160 1761 $252594 100.0% 2017 2019 100.0% Net Income available to common stockholders 2019 Horizontal Commonsize Analysis (Percentage Change Analysis) YYY Inc's Dec lance Sheets YYY Inc's December 31 Balance Sheets estions Ratio&CF Cmnsizev CmnsizeH Aportsch Assets 2017 2018 2019 Assets 2017 2018 Cash and cash Cash and cash equivalents $ 57,600 $ 7,282 $ 85,632 equivalents 100.0% Short-term investments $ - $- Short-term investments 100.0% Accounts Receivable $ 351,200 $632,160 $ 878,000 Accounts Receivable 100.0% Inventories $ 715,200 $ 1,287,360 $ 1,716,480 Inventories 100.0% Total current assets $ 1,124,000 $ 1,926,802 $ 2,680,112 Total current assets 100.0% Gross fixed asets $ 491,000 $ 1,202,950 $ 1,197,160 Gross fixed asets 100.0% Less: Accumulated Less: Accumulated depreciation $ 146,200 $ 263,160 $ 380,120 depreciation 100.0% Net plant and equipment $ 344,800 $ 939,790 $ 817,040 Net plant and equipment 100.0% Total assets $ 1,468,800 $ 2,866,592 $ 3,497,152 Total assets 100.0% Liabilities and equity Liabilities and equity Accounts payable $ 145,600 $ 524,160 $ 436,800 Accounts payable 100.0% Notes payable $ 200,000 $ 489,600 $ 300,000 Notes payable 100.0% Accruals $ 136,000 $636,808 $ 408,000 Accruals 100.0% Total current liabilities $ 481,600 $ 1,650,568 $ 1,144,800 Total current liabilities 100.0% Long-term bonds $ 323,432 $ 723,432 $ 400,000 Long-term bonds 100.0% Total liabilities $ 805,032 $ 2,374,000 $ 1,544,800 Total liabilities 100.0% Common stock $ 460,000 $ 460,000 $1,721,176 Common stock 100.0% Retained Earnings $ 203,768 $ 32,592 $ 231,176 Retained Earnings 100.0% Total common equity $ 663,768 $ 492,592 $ 1,952,352 Total common equity 100.0% Total liabilities and equity $ 1,468,800 $ 2,866,592 $ 3,497,152 Total liabilities and equity 100.0% YYY Inc's December 31 Income Statements 2017 2018 2019 Net Sales $ 3,432,000 $6,034,000 $ 7,035,600 Expenses/COGS excluding depr.: $ 2,864,000 $ 5,528,000 $5,875,992 Depreciation and Amortization $ 18,900 $ 116,960 $ 116,960 Other operating expenses $ 358,672 $ 519,988 $ 550,000 Total operating expenses $3,241,572 $ 6,164,948 $ 6,542,952 EBIT $ 190,428 $ (130,948) $ 492,648 Interest Expense $ 43,828 $ 136,012 $ 70,008 EBT $ 146,600 $ (266,960) $ 422,640 Taxes $ 58,640 $ (106,784) $ 169,056 $97.000 (160 1761 YYY Inc's December 31 Income Statements 2017 2018 2019 Net Sales 100.0% Expenses/COGS excluding 100.0% Depreciation and Amortiza 100.0% Other operating expenses 100.0% Total operating expenses 100.0% EBIT 100.0% Interest Expense 100.0% EBT 100.0% Taxes 100.0% Not Incoma unilable to common 252 50 A Not Income ilable to call on noy 1 2 4 5 There are 2 questions below. You are required to attempt both. Please use cell reference and formula (similar to Excel formula) to solve the problems so that the spreadsheet is dynamic one. Questions Ratio&CF CmnsizeV Cmnsizel AmortSch 1. You borrow $100,000 today and will repay the loan in equal installments at the end of the next 5 years. How much is your annual payment if the interest rate is 9.5%? Please prepare the schedule below. Loan amount= $100,000 Year Beg. Balance Annual Pmt Interest Pmt Principal Pmt End. Balance Time to repay- 1 8 Interest rate= 9.50% 2 3 Annual payment 4 11 5 6 7 5 years 9 10 12 13 14 15 16 17 2. If you borrow $100,000 today & repay it in equal installments at the end of months during the next 5 years, how much is your monthly payment if the interest rate is 9.5%? Please prepare the schedule below. Loan amount= $100,000 Year Month Beg. Balance Monthly Pmt Interest Pmt Principal Pmt End. Balance Time to repay 5 years 1 60 months 2 Interest rate= 9.50% per year 3 0.79% per mont 4 5 Monthly payment 6 7 18 19 20 21 1 22 23 8 9 24 25 10 11 26 27 28 29 30 31 32 33 2 34 35 36 37 38 39 40 | 41 42 43 44 45 3 3 46 M 47 48 49 50 51 12 13 14 15 16 17 18 19 20 21 22 23 24 25 26 27 28 29 30 31 32 33 34 35 36 37 38 39 40 41 42 43 44 45 46 47 48 49 50 51 52 53 54 55 56 57 58 59 60 52 53 54 55 56 57 4 58 59 60 61 62 63 64 65 66 67 68 69 5 70 71 72 74 75
Step by Step Solution
There are 3 Steps involved in it

Get step-by-step solutions from verified subject matter experts