

Question: Please help with all Please!! Please use simple python code! Exercise-2: The file named 'Electric_Vehicle_Population_Data.csv' contains the database of electric vehicles registered and operated in
 Please help with all Please!! Please use simple python code!
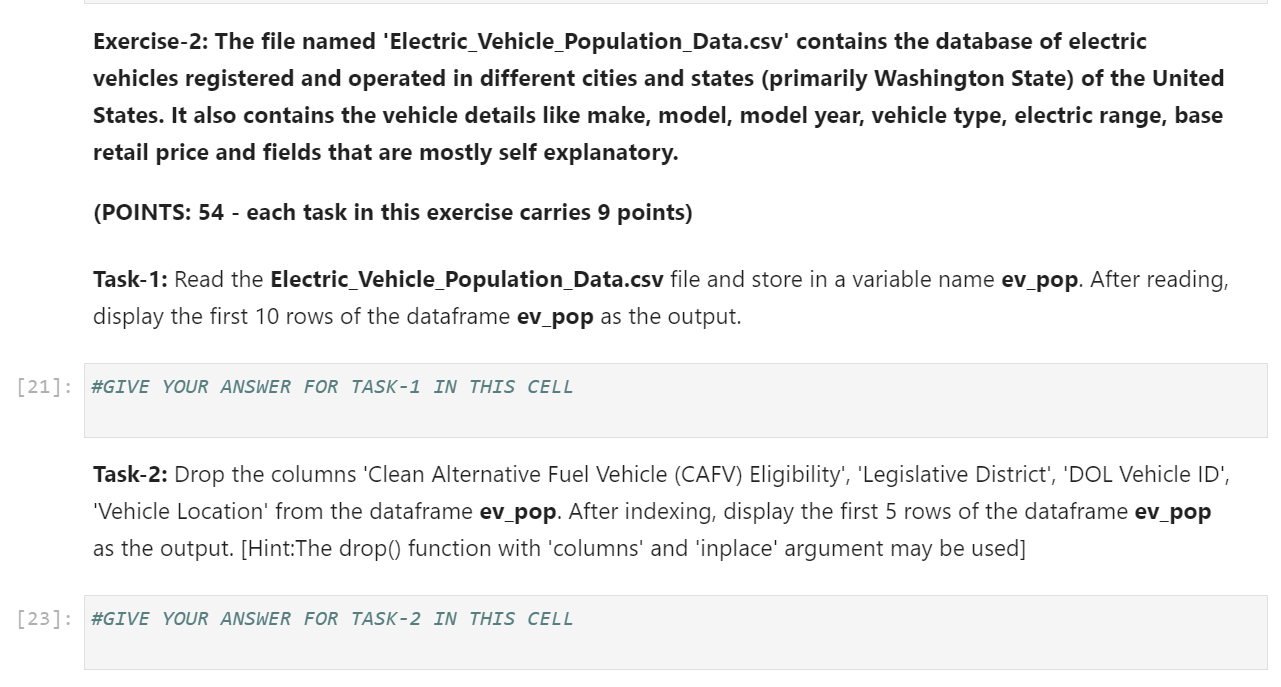
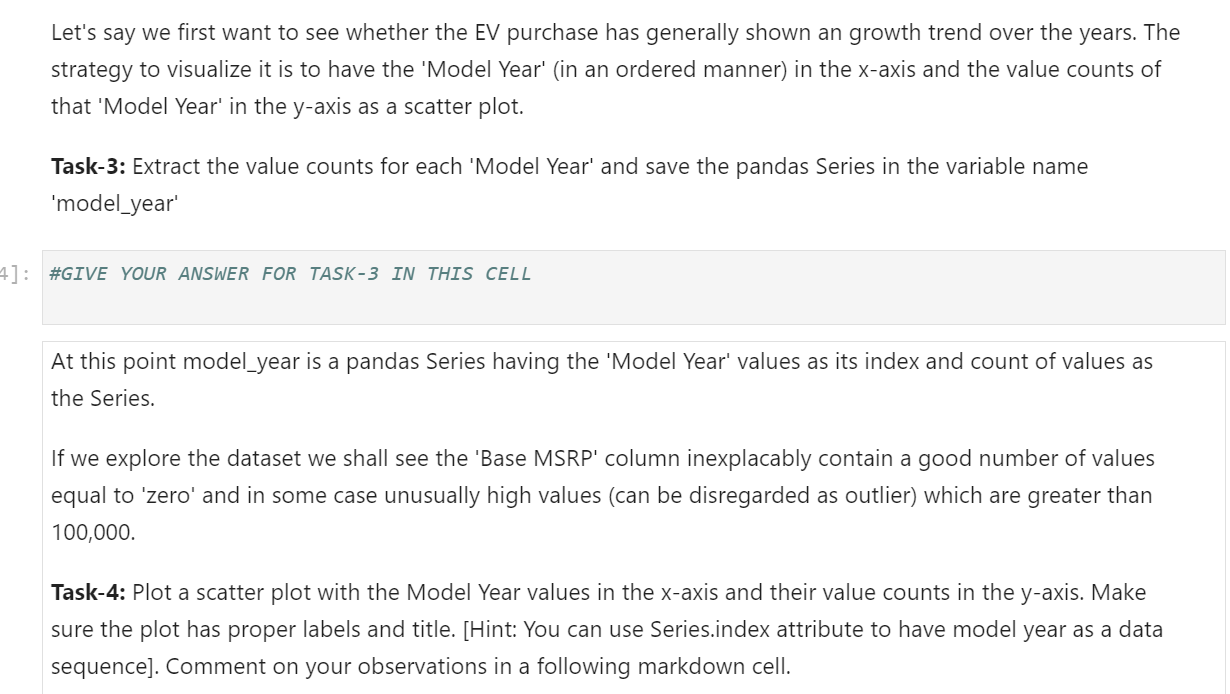
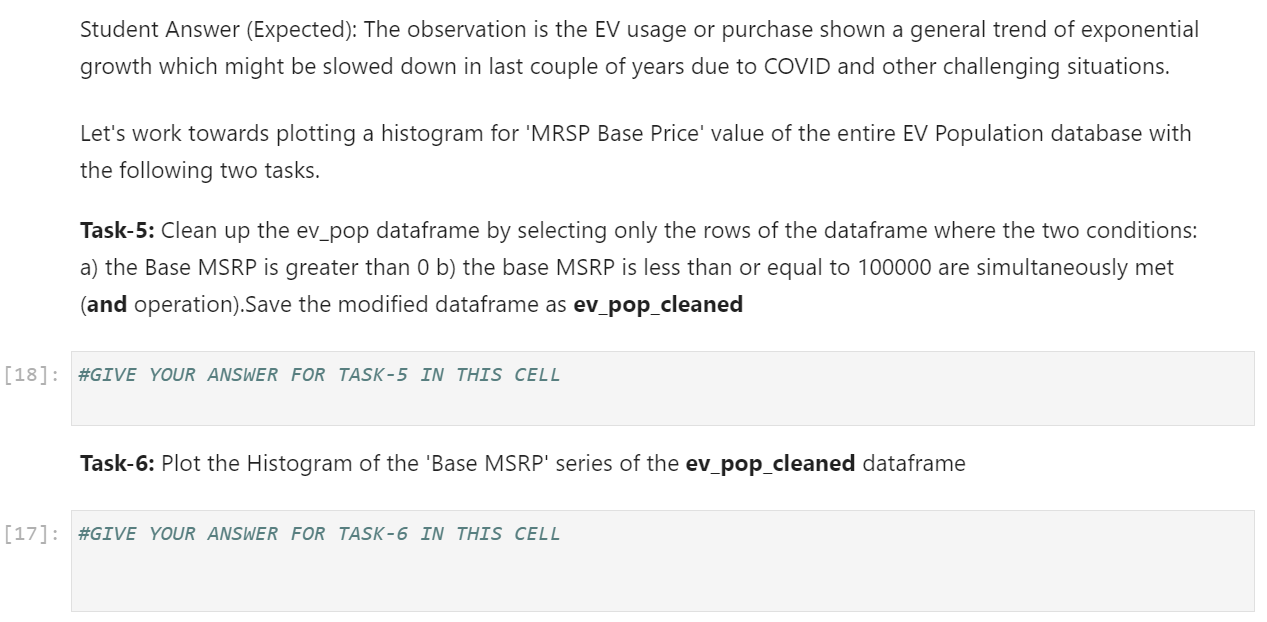
Exercise-2: The file named 'Electric_Vehicle_Population_Data.csv' contains the database of electric vehicles registered and operated in different cities and states (primarily Washington State) of the United States. It also contains the vehicle details like make, model, model year, vehicle type, electric range, base retail price and fields that are mostly self explanatory. (POINTS: 54 - each task in this exercise carries 9 points) Task-1: Read the Electric_Vehicle_Population_Data.csv file and store in a variable name ev_pop. After reading, display the first 10 rows of the dataframe ev_pop as the output. \#GIVE YOUR ANSWER FOR TASK-1 IN THIS CELL Task-2: Drop the columns 'Clean Alternative Fuel Vehicle (CAFV) Eligibility', 'Legislative District', 'DOL Vehicle ID', 'Vehicle Location' from the dataframe ev_pop. After indexing, display the first 5 rows of the dataframe ev_pop as the output. [Hint:The drop() function with 'columns' and 'inplace' argument may be used] \#GIVE YOUR ANSWER FOR TASK-2 IN THIS CELL Let's say we first want to see whether the EV purchase has generally shown an growth trend over the years. The strategy to visualize it is to have the 'Model Year' (in an ordered manner) in the x-axis and the value counts of that 'Model Year' in the y-axis as a scatter plot. Task-3: Extract the value counts for each 'Model Year' and save the pandas Series in the variable name 'model_year' \#GIVE YOUR ANSWER FOR TASK-3 IN THIS CELL At this point model_year is a pandas Series having the 'Model Year' values as its index and count of values as the Series. If we explore the dataset we shall see the 'Base MSRP' column inexplacably contain a good number of values equal to 'zero' and in some case unusually high values (can be disregarded as outlier) which are greater than 100,000 Task-4: Plot a scatter plot with the Model Year values in the x-axis and their value counts in the y-axis. Make sure the plot has proper labels and title. [Hint: You can use Series.index attribute to have model year as a data sequence]. Comment on your observations in a following markdown cell. Student Answer (Expected): The observation is the EV usage or purchase shown a general trend of exponential growth which might be slowed down in last couple of years due to COVID and other challenging situations. Let's work towards plotting a histogram for 'MRSP Base Price' value of the entire EV Population database with the following two tasks. Task-5: Clean up the ev_pop dataframe by selecting only the rows of the dataframe where the two conditions: a) the Base MSRP is greater than 0b ) the base MSRP is less than or equal to 100000 are simultaneously met (and operation).Save the modified dataframe as ev_pop_cleaned \#GIVE YOUR ANSWER FOR TASK-5 IN THIS CELL Task-6: Plot the Histogram of the 'Base MSRP' series of the ev_pop_cleaned dataframe \#GIVE YOUR ANSWER FOR TASK-6 IN THIS CELL
Step by Step Solution
There are 3 Steps involved in it

Get step-by-step solutions from verified subject matter experts