

Question: Please help with allocation formulas I cannot remember how to find them Below are annual returns for 5 selected mutual funds. For now, do not
 Please help with allocation formulas I cannot remember how to find them
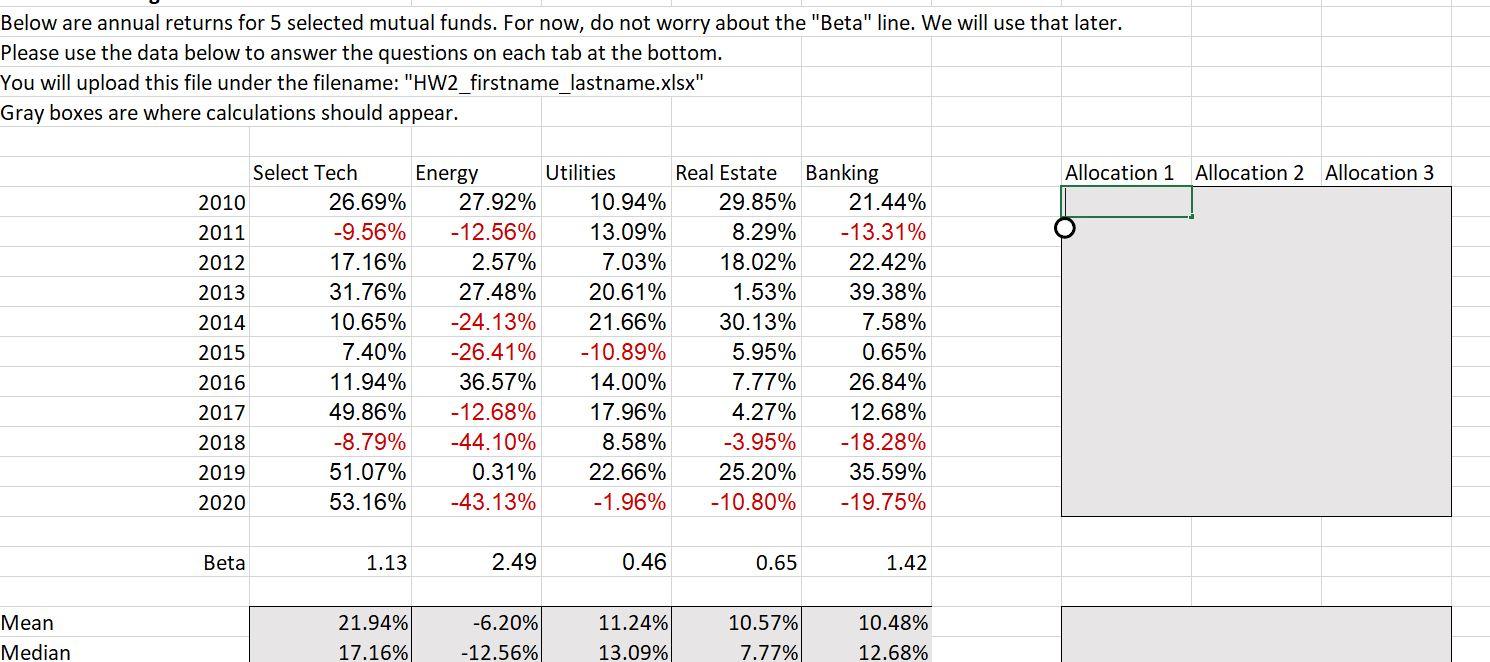
Below are annual returns for 5 selected mutual funds. For now, do not worry about the "Beta" line. We will use that later. Please use the data below to answer the questions on each tab at the bottom. You will upload this file under the filename: "HW2_firstname_lastname.xlsx" Gray boxes are where calculations should appear. Allocation 1 Allocation 2 Allocation 3 Select Tech Energy Utilities Real Estate Banking 2010 26.69% 27.92% 10.94% 29.85% 21.44% 2011 -9.56% -12.56% 13.09% 8.29% -13.31% 2012 17.16% 2.57% 7.03% 18.02% 22.42% 2013 31.76% 27.48% 20.61% 1.53% 39.38% 2014 10.65% -24.13% 21.66% 30.13% 7.58% 2015 7.40% -26.41% -10.89% 5.95% 0.65% 2016 11.94% 36.57% 14.00% 7.77% 26.84% 2017 49.86% -12.68% 17.96% 4.27% 12.68% 2018 -8.79% -44.10% 8.58% -3.95% -18.28% 2019 51.07% 0.31% 22.66% 25.20% 35.59% 2020 53.16% -43.13% -1.96% -10.80% -19.75% Beta 1.13 2.49 0.46 0.65 1.42 Mean Median 21.94% 17.16% -6.20% -12.56% 11.24% 13.09% 10.57% 7.77% 10.48% 12.68% Mean Median Standard Deviation Coefficient of Variation 21.94% 17.16% 23% 103% -6.20% -12.56% 28% -452% 11.24% 13.09% 10% 92% 10.57% 7.77% 14% 129% 10.48% 12.68% 21% 201% Below are annual returns for 5 selected mutual funds. For now, do not worry about the "Beta" line. We will use that later. Please use the data below to answer the questions on each tab at the bottom. You will upload this file under the filename: "HW2_firstname_lastname.xlsx" Gray boxes are where calculations should appear. Allocation 1 Allocation 2 Allocation 3 Select Tech Energy Utilities Real Estate Banking 2010 26.69% 27.92% 10.94% 29.85% 21.44% 2011 -9.56% -12.56% 13.09% 8.29% -13.31% 2012 17.16% 2.57% 7.03% 18.02% 22.42% 2013 31.76% 27.48% 20.61% 1.53% 39.38% 2014 10.65% -24.13% 21.66% 30.13% 7.58% 2015 7.40% -26.41% -10.89% 5.95% 0.65% 2016 11.94% 36.57% 14.00% 7.77% 26.84% 2017 49.86% -12.68% 17.96% 4.27% 12.68% 2018 -8.79% -44.10% 8.58% -3.95% -18.28% 2019 51.07% 0.31% 22.66% 25.20% 35.59% 2020 53.16% -43.13% -1.96% -10.80% -19.75% Beta 1.13 2.49 0.46 0.65 1.42 Mean Median 21.94% 17.16% -6.20% -12.56% 11.24% 13.09% 10.57% 7.77% 10.48% 12.68% Mean Median Standard Deviation Coefficient of Variation 21.94% 17.16% 23% 103% -6.20% -12.56% 28% -452% 11.24% 13.09% 10% 92% 10.57% 7.77% 14% 129% 10.48% 12.68% 21% 201%
Step by Step Solution
There are 3 Steps involved in it

Get step-by-step solutions from verified subject matter experts