

Question: Please Help with C The accompanying data describe spending for promoting a cholesterol-lowering drug by a major pharmaceutical company. The data cover 39 consecutive
Please Help with " C"
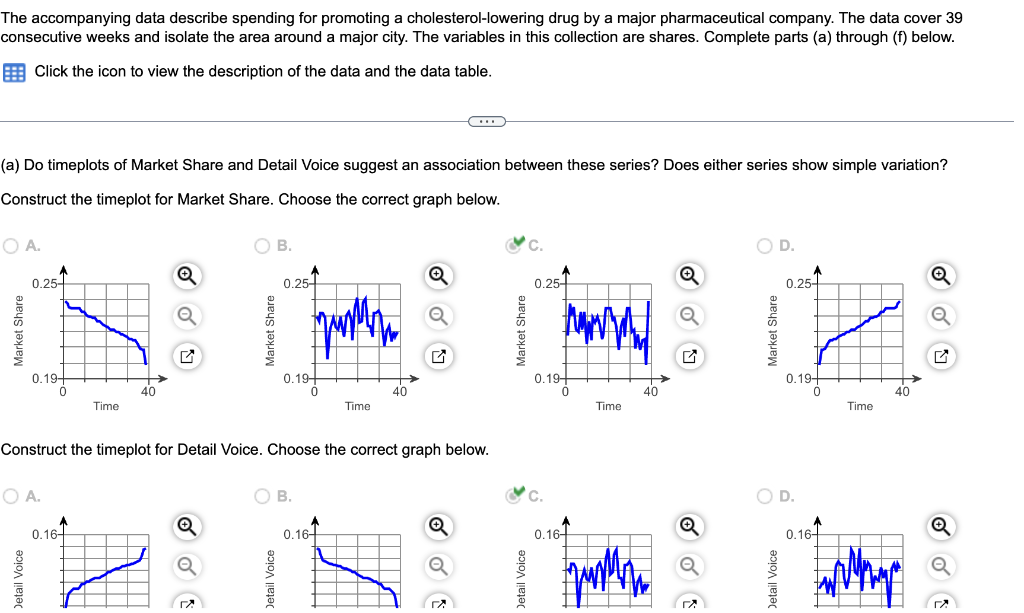
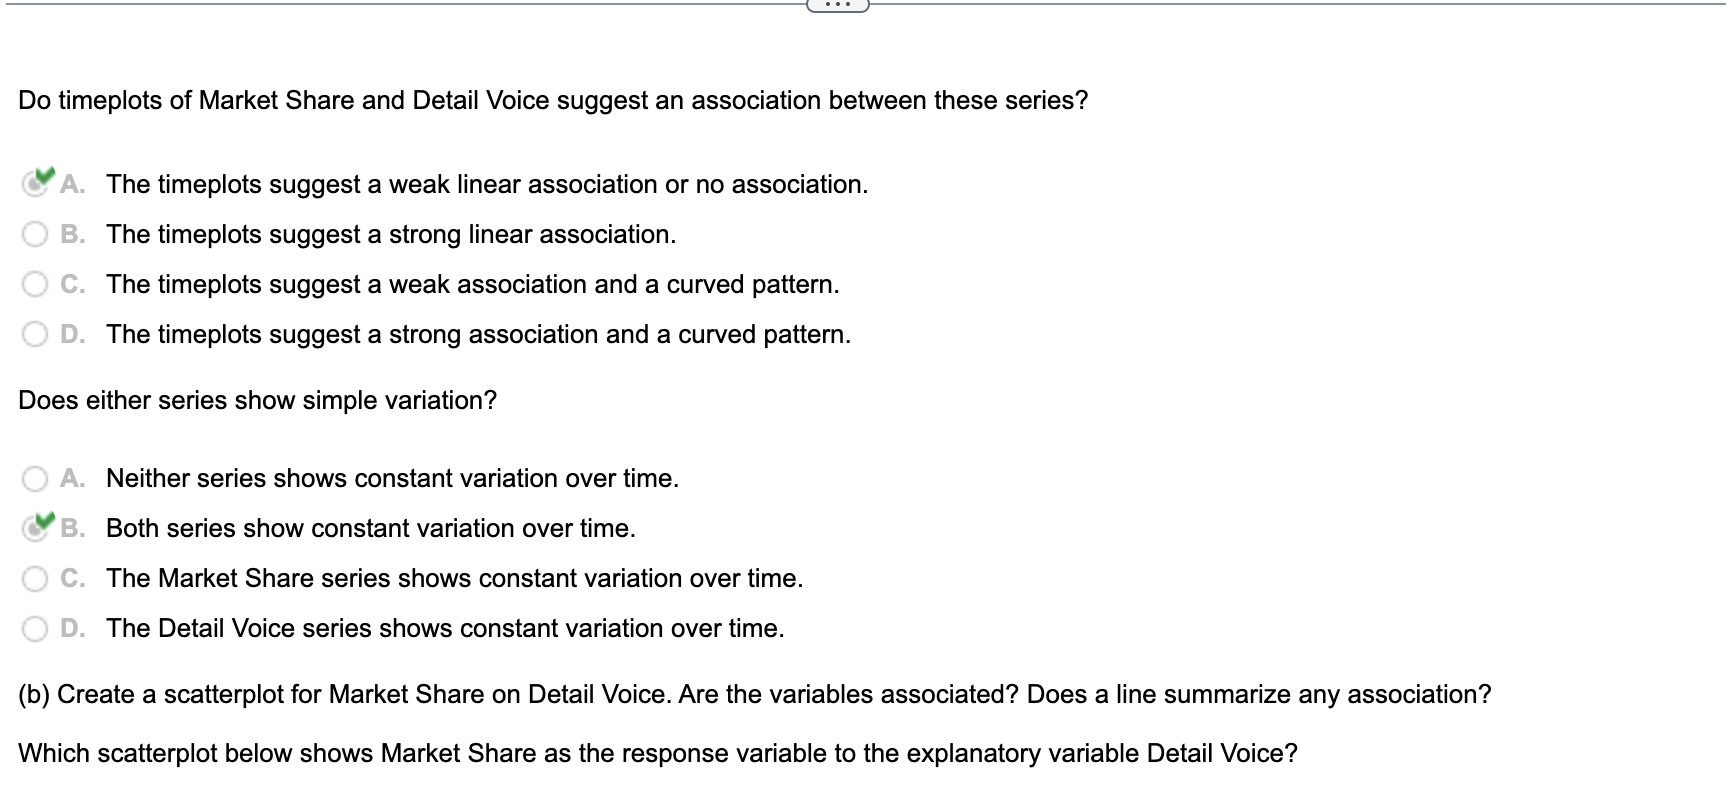
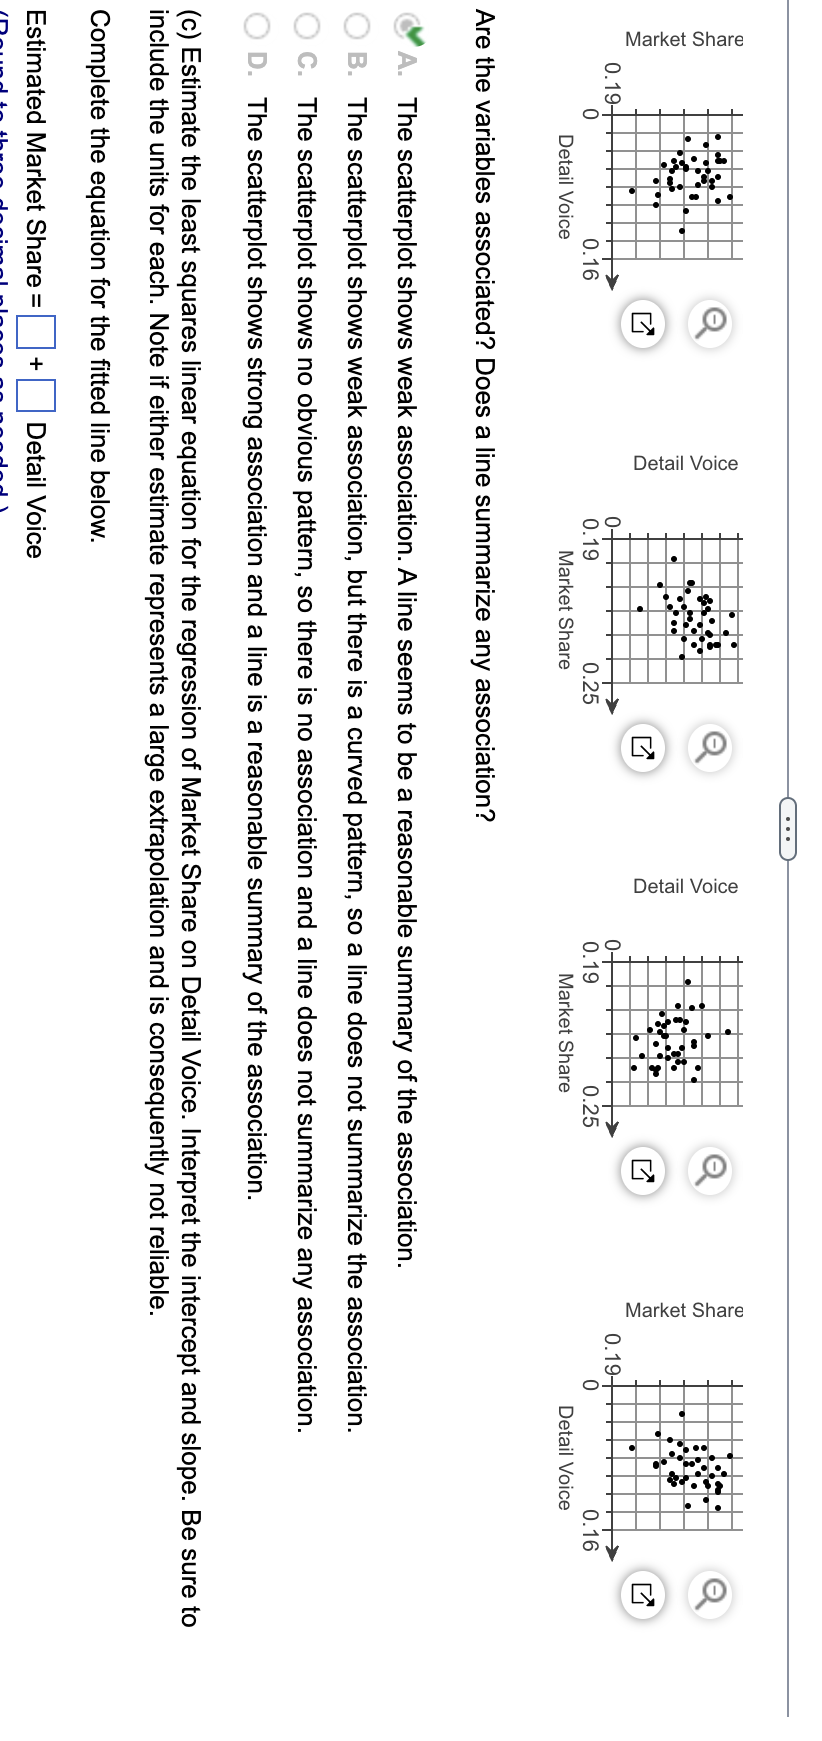
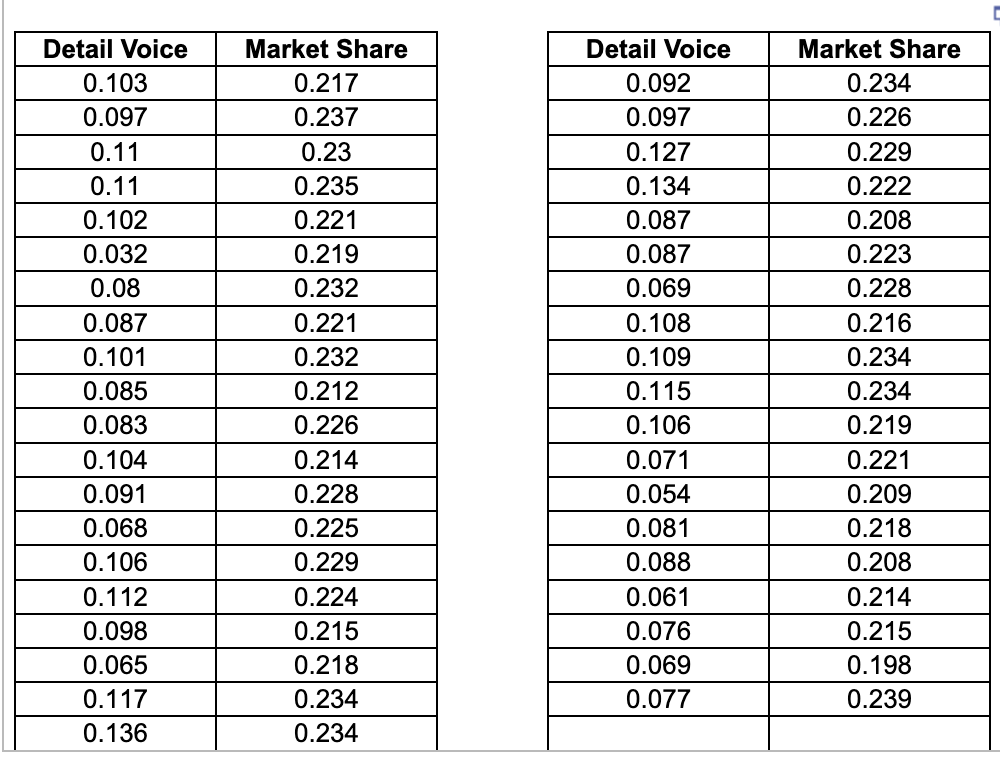
The accompanying data describe spending for promoting a cholesterol-lowering drug by a major pharmaceutical company. The data cover 39 consecutive weeks and isolate the area around a major city. The variables in this collection are shares. Complete parts (a) through (f) below. Click the icon to view the description of the data and the data table. (a) Do timeplots of Market Share and Detail Voice suggest an association between these series? Does either series show simple variation? Construct the timeplot for Market Share. Choose the correct graph below. A. B. c. D. Construct the timeplot for Detail Voice. Choose the correct graph below. A. B. C. n Do timeplots of Market Share and Detail Voice suggest an association between these series? A. The timeplots suggest a weak linear association or no association. B. The timeplots suggest a strong linear association. C. The timeplots suggest a weak association and a curved pattern. D. The timeplots suggest a strong association and a curved pattern. Does either series show simple variation? A. Neither series shows constant variation over time. B. Both series show constant variation over time. C. The Market Share series shows constant variation over time. D. The Detail Voice series shows constant variation over time. (b) Create a scatterplot for Market Share on Detail Voice. Are the variables associated? Does a line summarize any association? Which scatterplot below shows Market Share as the response variable to the explanatory variable Detail Voice? Detail VoiceStep by Step Solution
There are 3 Steps involved in it
1 Expert Approved Answer
Step: 1 Unlock

Question Has Been Solved by an Expert!
Get step-by-step solutions from verified subject matter experts
Step: 2 Unlock
Step: 3 Unlock