

Question: please help with excels this is the only part I need help with The following questions refer to the information and output below. The university
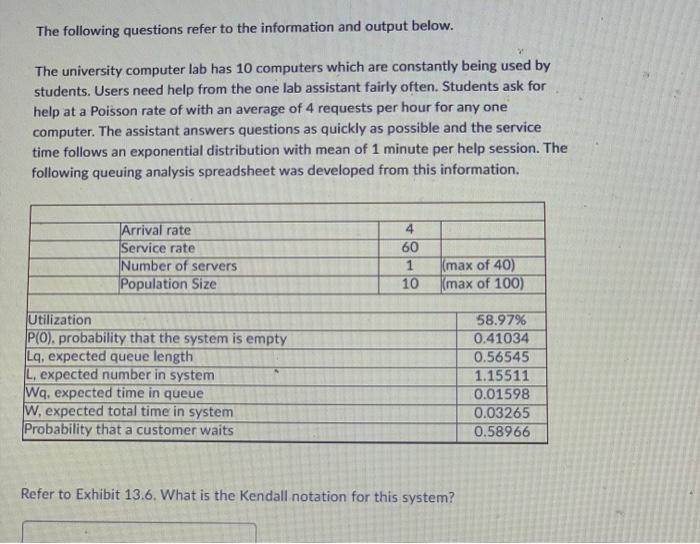
The following questions refer to the information and output below. The university computer lab has 10 computers which are constantly being used by students. Users need help from the one lab assistant fairly often. Students ask for help at a Poisson rate of with an average of 4 requests per hour for any one computer. The assistant answers questions as quickly as possible and the service time follows an exponential distribution with mean of 1 minute per help session. The following queuing analysis spreadsheet was developed from this information Arrival rate Service rate Number of servers Population Size 60 1 10 (max of 40) (max of 100) Utilization P(O), probability that the system is empty Lq, expected queue length L. expected number in system Wq, expected time in queue W, expected total time in system Probability that a customer waits 58.97% 0.41034 0.56545 1.15511 0.01598 0.03265 0.58966 Refer to Exhibit 13.6. What is the Kendall notation for this system
Step by Step Solution
There are 3 Steps involved in it

Get step-by-step solutions from verified subject matter experts