

Question: please help with exercise 1 and 2, python 3.7 Exercise 1: Plot the following function: F(K, L) = AX KZ(1-a) In order to plot this
please help with exercise 1 and 2, python 3.7 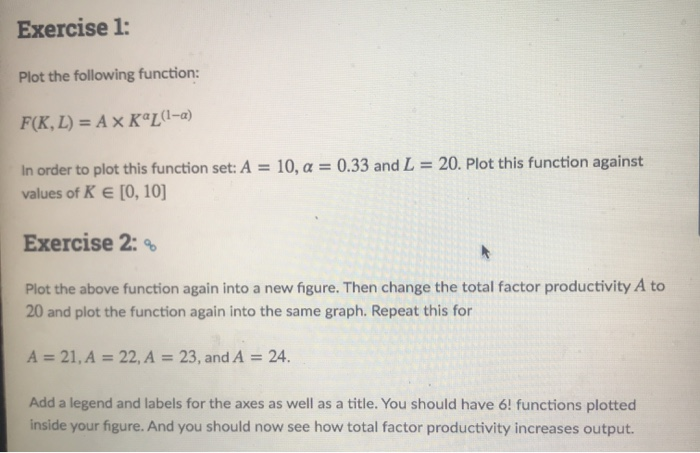
Exercise 1: Plot the following function: F(K, L) = AX KZ(1-a) In order to plot this function set: A = 10, a = 0.33 and L = 20. Plot this function against values of Ke [0, 10] Exercise 2: % Plot the above function again into a new figure. Then change the total factor productivity A to 20 and plot the function again into the same graph. Repeat this for A = 21, A = 22, A = 23, and A = 24. Add a legend and labels for the axes as well as a title. You should have 6! functions plotted inside your figure. And you should now see how total factor productivity increases output
Step by Step Solution
There are 3 Steps involved in it
1 Expert Approved Answer
Step: 1 Unlock

Question Has Been Solved by an Expert!
Get step-by-step solutions from verified subject matter experts
Step: 2 Unlock
Step: 3 Unlock