

Question: please help with lab asap, thank you! Data and calculations Table 2: Galvanic cells and cell potential (voltage) data Cell Diagram Calculated Voltage 1 ZnZn-
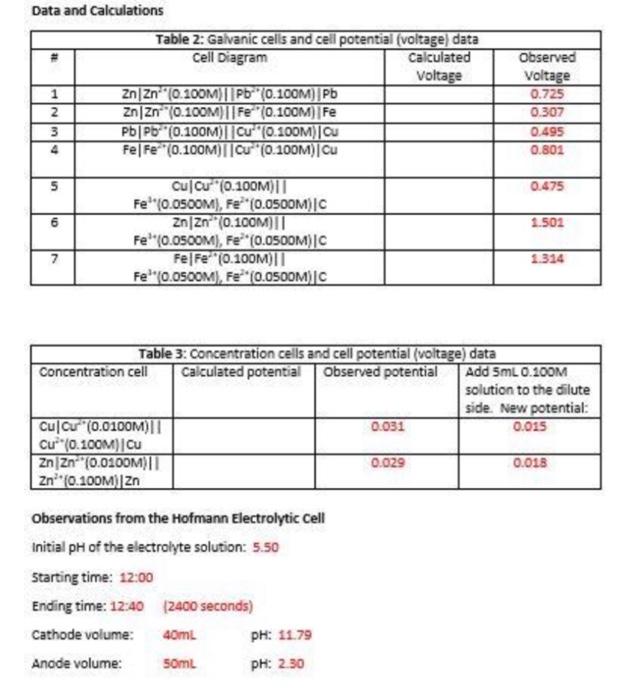
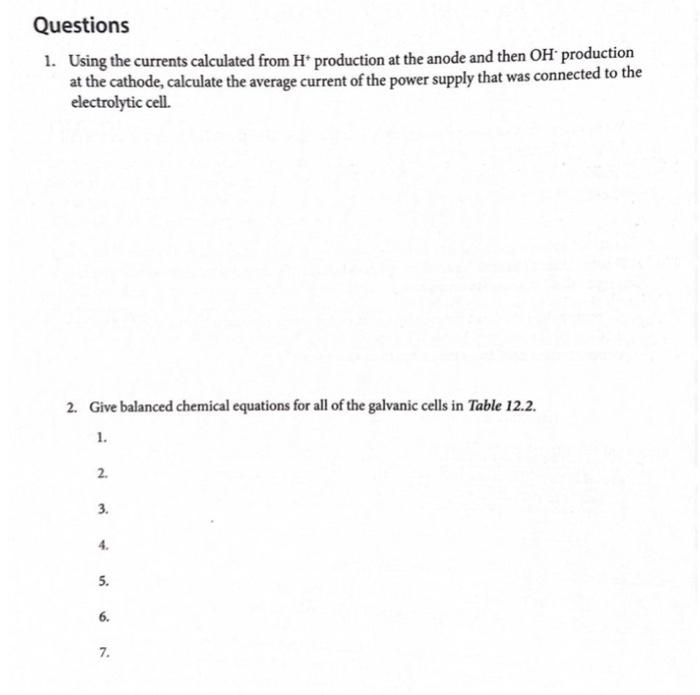
Data and calculations Table 2: Galvanic cells and cell potential (voltage) data Cell Diagram Calculated Voltage 1 ZnZn-" (0.100M) || Pb (0.100M) Pb ZnZn (0.100M)||Fe (0.100M) Fe 3 PbPb (0.100M)||Cu" (0.100M) Ou 4 FelFe (0.100M)||C" (0.100M)Cu INM Observed Voltage 0.725 0.307 0.495 0.801 5 0.475 6 1.502 Cu Cu (0.100M) Fe" (0.05OOM), Fe* (0.05OOM) |C ZnZn (0.100M)|| Fe'(0.0500M), Fe**(0.OSOOM)|C Fe|F="(0.100011 Fe'"0.0500M), Fe(0.0500M) C 7 1.314 Table 3: Concentration cells and cell potential (voltage) data Concentration cell Calculated potential Observed potential Add 5mL 0.100M solution to the dilute side. New potential: Cul Cu (0.0100M) 0.031 0.015 | C (0.10CM][Cu ZnZn (0.0100M)| 0.029 0.018 Zn* (0.100M) Zn Observations from the Hofmann Electrolytic cell Initial pH of the electrolyte solution: 5.50 Starting time: 12:00 Ending time: 12:40 (2400 seconds) Cathode volume: 40mL PH: 1179 Anode volume: 50ml PH: 2.30 Questions 1. Using the currents calculated from H* production at the anode and then OHproduction at the cathode, calculate the average current of the power supply that was connected to the electrolytic cell. 2. Give balanced chemical equations for all of the galvanic cells in Table 12.2. 1. 2. 3. 4. 5. 6. 7
Step by Step Solution
There are 3 Steps involved in it

Get step-by-step solutions from verified subject matter experts