

Question: Data and calculations Table 2: Galvanic cells and cell potential (voltage) data Cell Diagram Calculated Voltage 1 ZnZn- (0.100M) || Pb (0.100M) Pb ZnZn (0.100M)||Fe
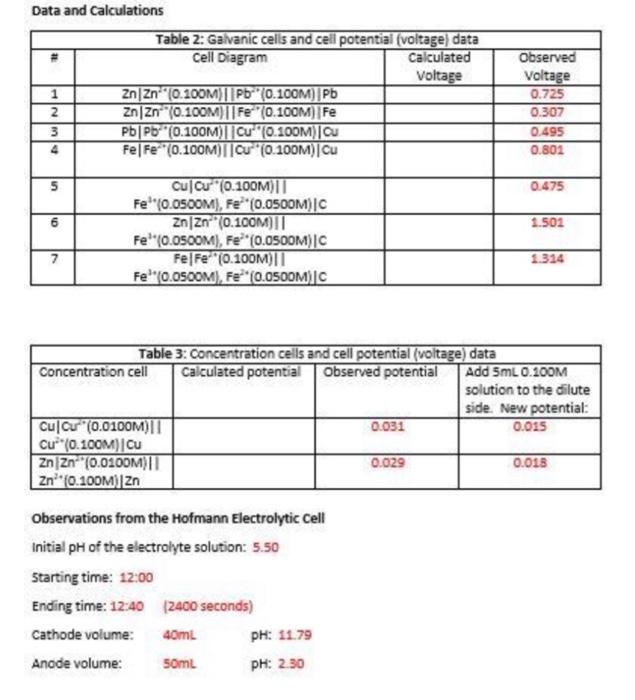
Data and calculations Table 2: Galvanic cells and cell potential (voltage) data Cell Diagram Calculated Voltage 1 ZnZn-" (0.100M) || Pb (0.100M) Pb ZnZn (0.100M)||Fe (0.100M) Fe 3 PbPb (0.100M)||Cu" (0.100M) Ou 4 FelFe (0.100M)||C" (0.100M)Cu INM Observed Voltage 0.725 0.307 0.495 0.801 5 0.475 6 1.502 Cu Cu (0.100M) Fe" (0.05OOM), Fe* (0.05OOM) |C ZnZn (0.100M)|| Fe'(0.0500M), Fe**(0.OSOOM)|C Fe|F="(0.100011 Fe'"0.0500M), Fe(0.0500M) C 7 1.314 Table 3: Concentration cells and cell potential (voltage) data Concentration cell Calculated potential Observed potential Add 5mL 0.100M solution to the dilute side. New potential: Cul Cu (0.0100M) 0.031 0.015 | C (0.10CM][Cu ZnZn (0.0100M)| 0.029 0.018 Zn* (0.100M) Zn Observations from the Hofmann Electrolytic cell Initial pH of the electrolyte solution: 5.50 Starting time: 12:00 Ending time: 12:40 (2400 seconds) Cathode volume: 40mL PH: 1179 Anode volume: 50ml PH: 2.30
Step by Step Solution
There are 3 Steps involved in it

Get step-by-step solutions from verified subject matter experts