

Question: Please help with matlab: only question 20 but two screenshots to fill the whole question. chirp. mat data: 0.125644909399947 0.249906847984230 0.370751958799039 0.486152367331847 0.594121062902039 0.692747591348049 0.780233943055279
Please help with matlab: only question 20 but two screenshots to fill the whole question.
chirp. mat data: 0.125644909399947 0.249906847984230 0.370751958799039 0.486152367331847 0.594121062902039 0.692747591348049 0.780233943055279 0.854929978754953 0.915367704243347 0.960293685676943 0.988698890709846 0.999845248594489 0.993288245384169 0.968894909212887 0.926856595640121 0.867696054255054 0.792268344788454 0.701755273141557 0.597653133861130 0.481753674101715 0.356118333035693 0.223045957608909 0.0850343477201373 -0.0552638617969268 -0.195090322016128 -0.331634285195134 -0.462089166897627 -0.583711280932529 -0.693879563332754 -0.790155012375690 -0.870338506584776
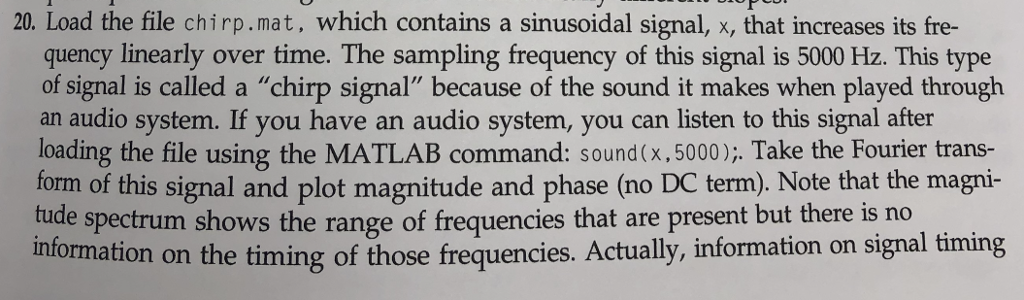
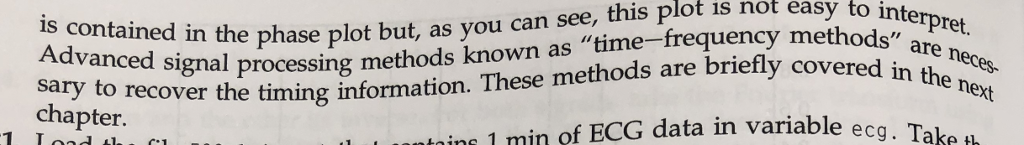
20. Load the file chirp.mat, which contains a sinusoidal signal, x, that increases its fre- quency linearly over time. The sampling frequency of this signal is 5000 Hz. This type of signal is called a "chirp signal" because of the sound it makes when played through an audio system. If you have an audio system, you can listen to this signal after loading the file using the MATLAB command: sound(x, 5000);. Take the Fourier trans- torm of this signal and plot magnitude and phase (no DC term). Note that the magni- tude spectrum shows the range of frequencies that are present but there is no information on the timing of those frequencies. Actually, information on signal timing 20. Load the file chirp.mat, which contains a sinusoidal signal, x, that increases its fre- quency linearly over time. The sampling frequency of this signal is 5000 Hz. This type of signal is called a "chirp signal" because of the sound it makes when played through an audio system. If you have an audio system, you can listen to this signal after loading the file using the MATLAB command: sound(x, 5000);. Take the Fourier trans- torm of this signal and plot magnitude and phase (no DC term). Note that the magni- tude spectrum shows the range of frequencies that are present but there is no information on the timing of those frequencies. Actually, information on signal timing
Step by Step Solution
There are 3 Steps involved in it

Get step-by-step solutions from verified subject matter experts