

Question: please help with part 2, part 1 is in the images given below on the excel sheets. Part 2 In this part of your assignment,
please help with part 2, part 1 is in the images given below on the excel sheets.
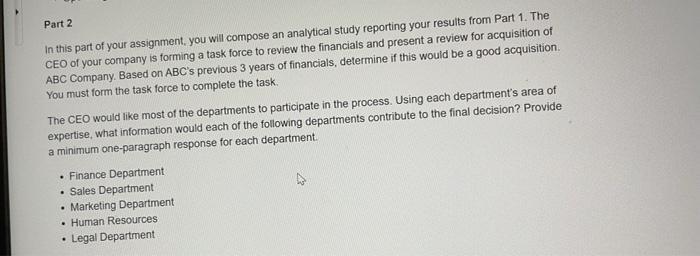
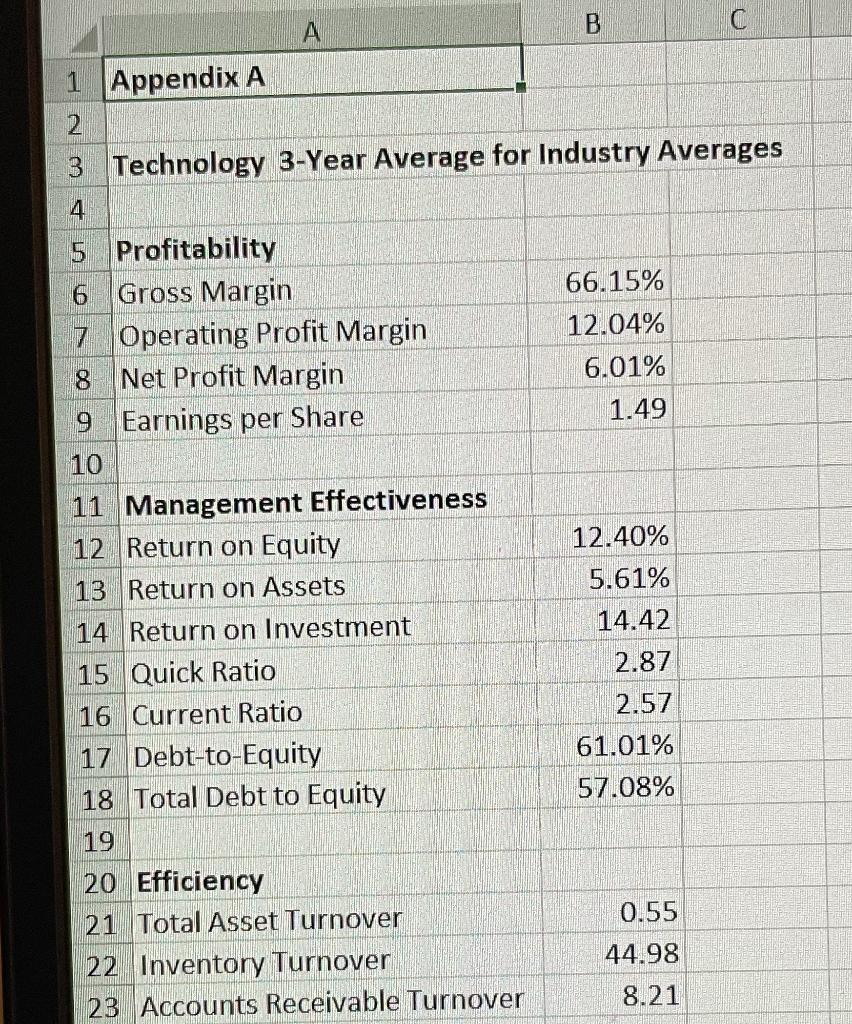
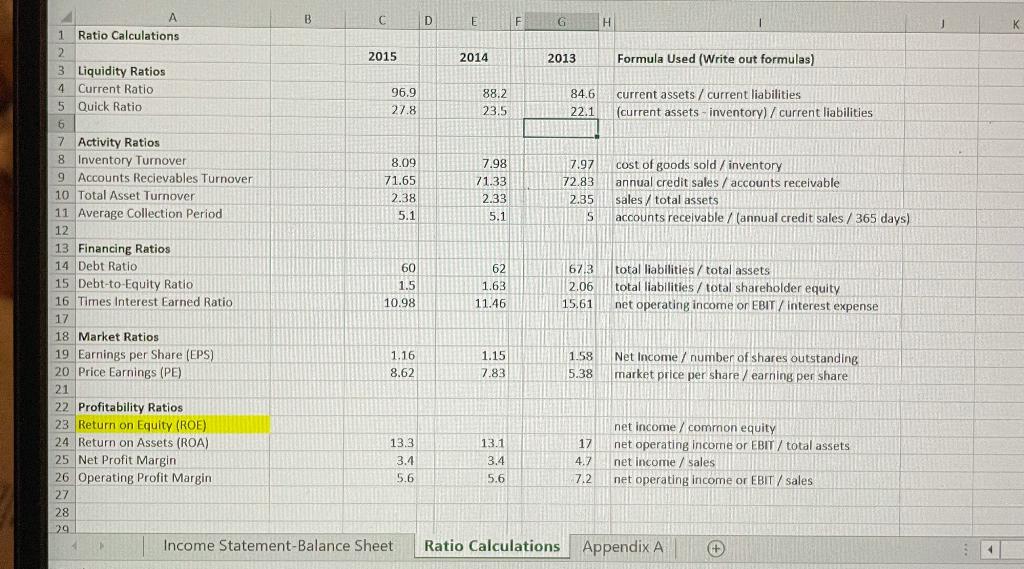
Part 2 In this part of your assignment, you will compose an analytical study reporting your results from Part 1. The CEO of your company is forming a task force to review the financials and present a review for acquisition of ABC Company. Based on ABC's previous 3 years of financials, determine if this would be a good acquisition You must form the task force to complete the task The CEO would like most of the departments to participate in the process. Using each department's area of expertise, what information would each of the following departments contribute to the final decision? Provide a minimum one-paragraph response for each department. Finance Department Sales Department Marketing Department Human Resources Legal Department A B 2 1 Appendix A 2 3 Technology 3-Year Average for Industry Averages 4 5 Profitability 6 Gross Margin 66.15% 7 Operating Profit Margin 12.04% 8 Net Profit Margin 6.01% 9 Earnings per Share 1.49 10 11 Management Effectiveness 12 Return on Equity 12.40% 13 Return on Assets 5.61% 14 Return on Investment 14.42 15 Quick Ratio 2.87 16 Current Ratio 2.57 17 Debt-to-Equity 61.01% 18 Total Debt to Equity 57.08% 19 20 Efficiency 21 Total Asset Turnover 0.55 22 Inventory Turnover 44.98 23 Accounts Receivable Turnover 8.21 D E F G H K 2014 2013 Formula Used (Write out formulas) 88.2 23.5 84.6 22.1 current assets / current liabilities (current assets - inventory) / current liabilities 7.98 71.33 2.33 5.1 7.97 72.83 2.35 5 cost of goods sold / inventory annual credit sales / accounts receivable sales / total assets accounts receivable/ (annual credit sales / 365 days) A B 1 Ratio Calculations 2 2015 3 Liquidity Ratios 4 Current Ratio 96,9 5 Quick Ratio 27.8 6 7 Activity Ratios 8 Inventory Turnover 8.09 9 Accounts Recievables Turnover 71.65 10 Total Asset Turnover 2.38 11 Average Collection Period 5.1 12 13 Financing Ratios 14 Debt Ratio 60 15 Debt-to-Equity Ratio 1.5 16 Times Interest Earned Ratio 10.98 17 18 Market Ratios 19 Earnings per Share (EPS) 1.16 20 Price Earnings (PE) 8.62 21 22 Profitability Ratios 23. Return on Equity (ROE) 24 Return on Assets (ROA) 13.3 25 Net Profit Margin 3.4 26 Operating Profit Margin 5.6 27 28 29 Income Statement-Balance Sheet 62 1.63 11.46 67.3 2.06 15.61 total liabilities/total assets total liabilities / total shareholder equity net operating income or EBIT/ interest expense 1.15 7.83 1.58 5.38 Net Income / number of shares outstanding market price per share / earning per share 13.1 3.4 5.6 17 4.7 net income / common equity net operating income or EBIT / total assets net income / sales net operating income or EBIT/ sales 7.2. Ratio Calculations Appendix A Part 2 In this part of your assignment, you will compose an analytical study reporting your results from Part 1. The CEO of your company is forming a task force to review the financials and present a review for acquisition of ABC Company. Based on ABC's previous 3 years of financials, determine if this would be a good acquisition You must form the task force to complete the task The CEO would like most of the departments to participate in the process. Using each department's area of expertise, what information would each of the following departments contribute to the final decision? Provide a minimum one-paragraph response for each department. Finance Department Sales Department Marketing Department Human Resources Legal Department A B 2 1 Appendix A 2 3 Technology 3-Year Average for Industry Averages 4 5 Profitability 6 Gross Margin 66.15% 7 Operating Profit Margin 12.04% 8 Net Profit Margin 6.01% 9 Earnings per Share 1.49 10 11 Management Effectiveness 12 Return on Equity 12.40% 13 Return on Assets 5.61% 14 Return on Investment 14.42 15 Quick Ratio 2.87 16 Current Ratio 2.57 17 Debt-to-Equity 61.01% 18 Total Debt to Equity 57.08% 19 20 Efficiency 21 Total Asset Turnover 0.55 22 Inventory Turnover 44.98 23 Accounts Receivable Turnover 8.21 D E F G H K 2014 2013 Formula Used (Write out formulas) 88.2 23.5 84.6 22.1 current assets / current liabilities (current assets - inventory) / current liabilities 7.98 71.33 2.33 5.1 7.97 72.83 2.35 5 cost of goods sold / inventory annual credit sales / accounts receivable sales / total assets accounts receivable/ (annual credit sales / 365 days) A B 1 Ratio Calculations 2 2015 3 Liquidity Ratios 4 Current Ratio 96,9 5 Quick Ratio 27.8 6 7 Activity Ratios 8 Inventory Turnover 8.09 9 Accounts Recievables Turnover 71.65 10 Total Asset Turnover 2.38 11 Average Collection Period 5.1 12 13 Financing Ratios 14 Debt Ratio 60 15 Debt-to-Equity Ratio 1.5 16 Times Interest Earned Ratio 10.98 17 18 Market Ratios 19 Earnings per Share (EPS) 1.16 20 Price Earnings (PE) 8.62 21 22 Profitability Ratios 23. Return on Equity (ROE) 24 Return on Assets (ROA) 13.3 25 Net Profit Margin 3.4 26 Operating Profit Margin 5.6 27 28 29 Income Statement-Balance Sheet 62 1.63 11.46 67.3 2.06 15.61 total liabilities/total assets total liabilities / total shareholder equity net operating income or EBIT/ interest expense 1.15 7.83 1.58 5.38 Net Income / number of shares outstanding market price per share / earning per share 13.1 3.4 5.6 17 4.7 net income / common equity net operating income or EBIT / total assets net income / sales net operating income or EBIT/ sales 7.2. Ratio Calculations Appendix A
Step by Step Solution
There are 3 Steps involved in it

Get step-by-step solutions from verified subject matter experts