

Question: Please help with Part A & B. Thank you! Part A: refer to the graphs Part B: The Pareto chart indicates that most of the
Please help with Part A & B. Thank you!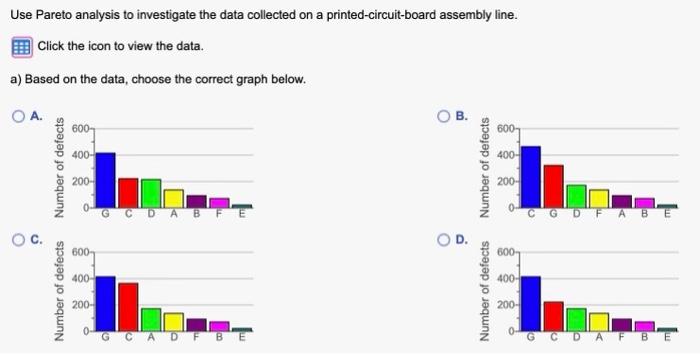
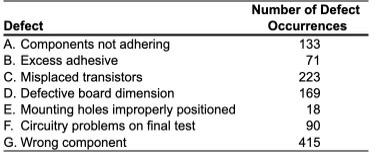
Use Pareto analysis to investigate the data collected on a printed-circuit-board assembly line. Click the icon to view the data. a) Based on the data, choose the correct graph below. \begin{tabular}{lc} Defect & Number of Defect Occurrences \\ \hline A. Components not adhering & 133 \\ B. Excess adhesive & 71 \\ C. Misplaced transistors & 223 \\ D. Defective board dimension & 169 \\ E. Mounting holes improperly positioned & 18 \\ F. Circuitry problems on final test & 90 \\ G. Wrong component & 415 \\ \hline \end{tabular}
Part A: refer to the graphs
Part B: The Pareto chart indicates that most of the errors, ______%, are the result of _______
Step by Step Solution
There are 3 Steps involved in it
1 Expert Approved Answer
Step: 1 Unlock

Question Has Been Solved by an Expert!
Get step-by-step solutions from verified subject matter experts
Step: 2 Unlock
Step: 3 Unlock