

Question: Please help with R code. 4. Discounts and Expected Prices. Does the frequency with which a supermarket product is offered at a discount affect the
Please help with R code.
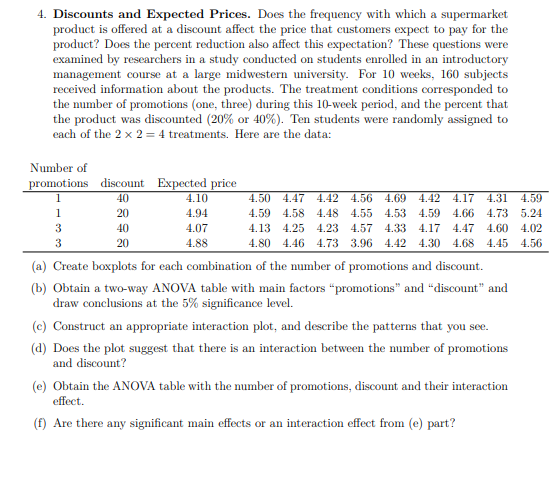
4. Discounts and Expected Prices. Does the frequency with which a supermarket product is offered at a discount affect the price that customers expect to pay for the product? Does the percent reduction also affect this expectation? These questions were examined by researchers in a study conducted on students enrolled in an introductory management course at a large midwestern university. For 10 weeks, 160 subjects received information about the products. The treatment conditions corresponded to the number of promotions (one, three) during this 10-week period, and the percent that the product was discounted (20% or 40%). Ten students were randomly assigned to each of the 2 x 2 = 4 treatments. Here are the data: 4.31 Number of promotions discount Expected price 1 40 4.10 4.50 4.47 4.42 4.56 4.69 4.42 4.17 4.59 1 20 4.94 4.59 4.58 4.48 4.55 4.53 4.59 4.66 4.73 5.24 3 40 4.07 4.13 4.25 4.23 4.57 4.33 4.17 4.47 4.60 4.02 3 20 4.88 4.80 4.46 4.73 3.96 4.42 4.30 4.68 4.45 4.56 (a) Create boxplots for each combination of the number of promotions and discount. (b) Obtain a two-way ANOVA table with main factors promotions" and "discount" and draw conclusions at the 5% significance level. (c) Construct an appropriate interaction plot, and describe the patterns that you see. (d) Does the plot suggest that there is an interaction between the number of promotions and discount? (e) Obtain the ANOVA table with the number of promotions, discount and their interaction effect. (f) Are there any significant main effects or an interaction effect from (e) part? 4. Discounts and Expected Prices. Does the frequency with which a supermarket product is offered at a discount affect the price that customers expect to pay for the product? Does the percent reduction also affect this expectation? These questions were examined by researchers in a study conducted on students enrolled in an introductory management course at a large midwestern university. For 10 weeks, 160 subjects received information about the products. The treatment conditions corresponded to the number of promotions (one, three) during this 10-week period, and the percent that the product was discounted (20% or 40%). Ten students were randomly assigned to each of the 2 x 2 = 4 treatments. Here are the data: 4.31 Number of promotions discount Expected price 1 40 4.10 4.50 4.47 4.42 4.56 4.69 4.42 4.17 4.59 1 20 4.94 4.59 4.58 4.48 4.55 4.53 4.59 4.66 4.73 5.24 3 40 4.07 4.13 4.25 4.23 4.57 4.33 4.17 4.47 4.60 4.02 3 20 4.88 4.80 4.46 4.73 3.96 4.42 4.30 4.68 4.45 4.56 (a) Create boxplots for each combination of the number of promotions and discount. (b) Obtain a two-way ANOVA table with main factors promotions" and "discount" and draw conclusions at the 5% significance level. (c) Construct an appropriate interaction plot, and describe the patterns that you see. (d) Does the plot suggest that there is an interaction between the number of promotions and discount? (e) Obtain the ANOVA table with the number of promotions, discount and their interaction effect. (f) Are there any significant main effects or an interaction effect from (e) part
Step by Step Solution
There are 3 Steps involved in it

Get step-by-step solutions from verified subject matter experts