

Question: Please help with R coding!!! Consider the following R-code set.seed (50) n = 50 x1 = run if (n ,10,30) x2 = runif (n ,5
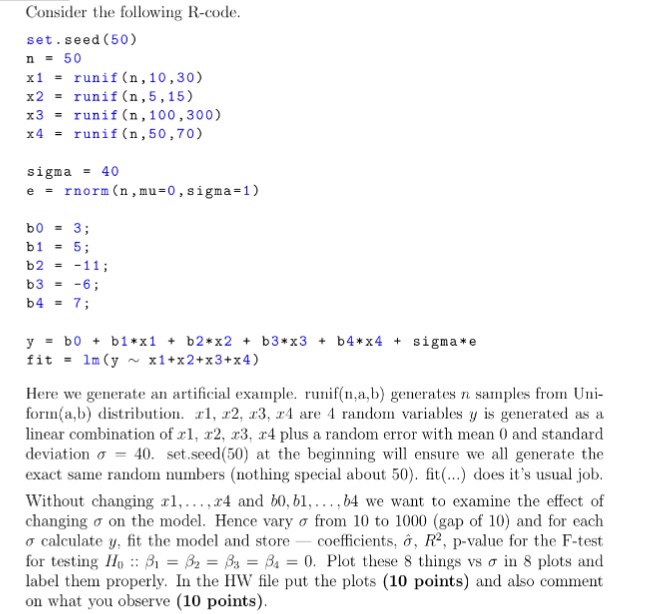
Consider the following R-code set.seed (50) n = 50 x1 = run if (n ,10,30) x2 = runif (n ,5 , 15) x3runif (n, 100,300) x4 runif (n , 50 ,70) sigma 40 e - rnorm (n , mu 0, sigma-1) b0 = 3; b2 = -11; b3 = -6; b4 = 7; b0 + b1*x1 + b2*x2 + b3*x3 = lm (y ~ x1+x2+x3+x4) + b4*x4 + sigma*e y fit Here we generate an artificial example. runif(n,a,b) generates n samples from U- form(ab) distribution. I' 1,22. I3zd are 4 random variables y is generated as a linear combination of rl, r2, r3, r4 plus a random error with mean 0 and standard deviation = 40, set,seed(50) at the beginning will ensure we all generate the exact same random numbers (nothing special about 50). fit does it's usual job Without changing rl,...,r4 and b0, bl,... . b4 we want to examine the effect of changing on the model. Hence vary from 10 to 1000 (gap of 10) and for each calculate y, fit the model and store coefficients, d, R2, p-value for the F-test for testing 11() ::=-A,- -0. Plot these 8 things vs in 8 plots and label them properly. In the HW file put the plots (10 points) and also comment on what you observe (10 points)
Step by Step Solution
There are 3 Steps involved in it

Get step-by-step solutions from verified subject matter experts