

Question: Please help with the Bullet Points below: Figure 2 shows a scatterplot of the two python lists inq5.py-populationandgas. The python fileq5.pyimports the functioncorr_coef() to calculate
Please help with the Bullet Points below:
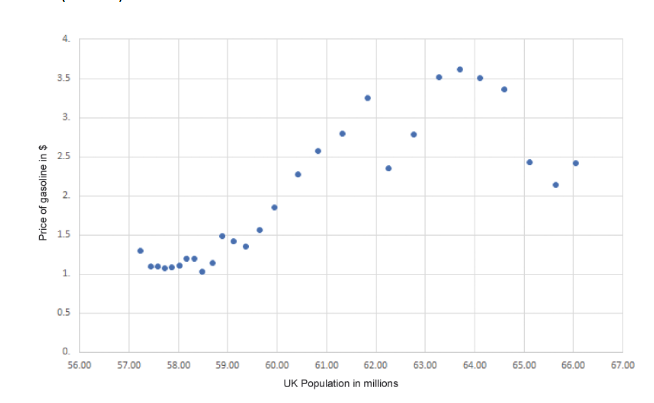
Figure 2 shows a scatterplot of the two python lists inq5.py-populationandgas. The python fileq5.pyimports the functioncorr_coef() to calculate the correlation coefficient between two lists.
- Calculate the correlation coefficient and provide the resulting figure rounded to two decimal places.
- Classify the size of the effect
- Briefly discuss whether any effect you have found is likely to be causal.
?
Figure 2 Price of gasoline in the US (in $) Vs UK Population in millions. Both are from 1990 - 2017.
\f
Step by Step Solution
There are 3 Steps involved in it
1 Expert Approved Answer
Step: 1 Unlock

Question Has Been Solved by an Expert!
Get step-by-step solutions from verified subject matter experts
Step: 2 Unlock
Step: 3 Unlock