

Question: There are two approaches you can use: add suitable code to the provided file, then run it run the provided file first, to load the
There are two approaches you can use:
add suitable code to the provided file, then run it
run the provided file first, to load the required function and data into memory, then do the calculation in the interactive Python shell.
Feel free to choose the approach you prefer.
a.Figure 1 charts data about the highest points, i.e. the points with the highest altitudes above sea level, in each of 56 European countries (Wikipedia, 2017).
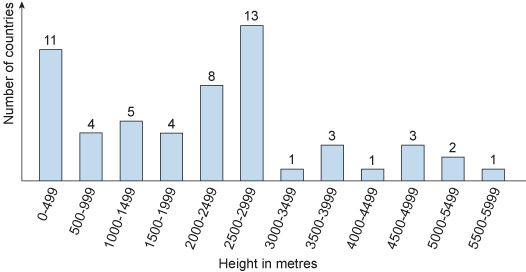
DATA LIST: https://codeshare.io/Gk30pp
https://codeshare.io/alld4j imports the Python function median. Use this function to find the median of the list heights.
Give the median, correct to the nearest whole number. Also copy and paste the Python code you used and briefly (in one or two sentences) explain how you ran it.
For this list of data the mean is 2185, which is smaller than the median. From looking at Figure 1 briefly suggest a possible reason.
----------------------
Part 2
Open this and inspect its contents. The lists cars and news contain yearly data about the number of cars on the road in the UK and the circulation of the Guardian newspaper respectively, over the years 2006-2016. Figure 2 shows a scatterplot of the two datasets. https://codeshare.io/GLyjWg
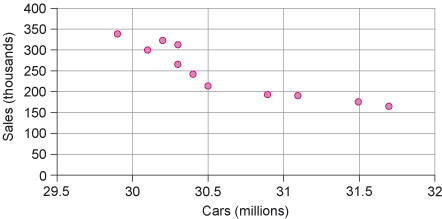
Using the i= function corr_coef , calculate the correlation coefficient between two lists. Use this function to calculate the correlation coefficient.
Step by Step Solution
There are 3 Steps involved in it

Get step-by-step solutions from verified subject matter experts