

Question: Please help with the Dividends Paid (cell 109). Average 2017 $ 2018 % of TA 2019 % of TA % of TA $ $ 6%
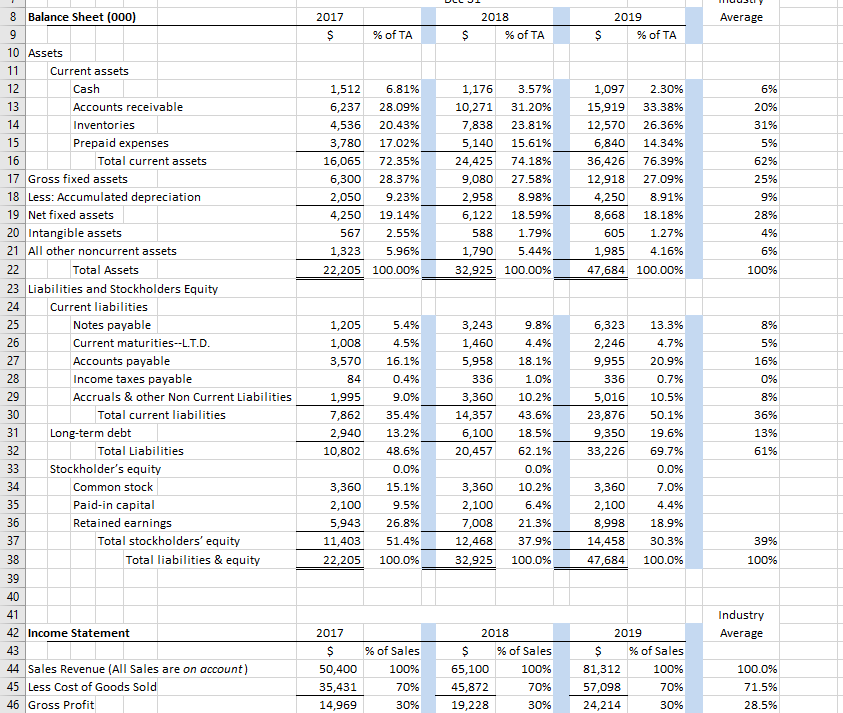
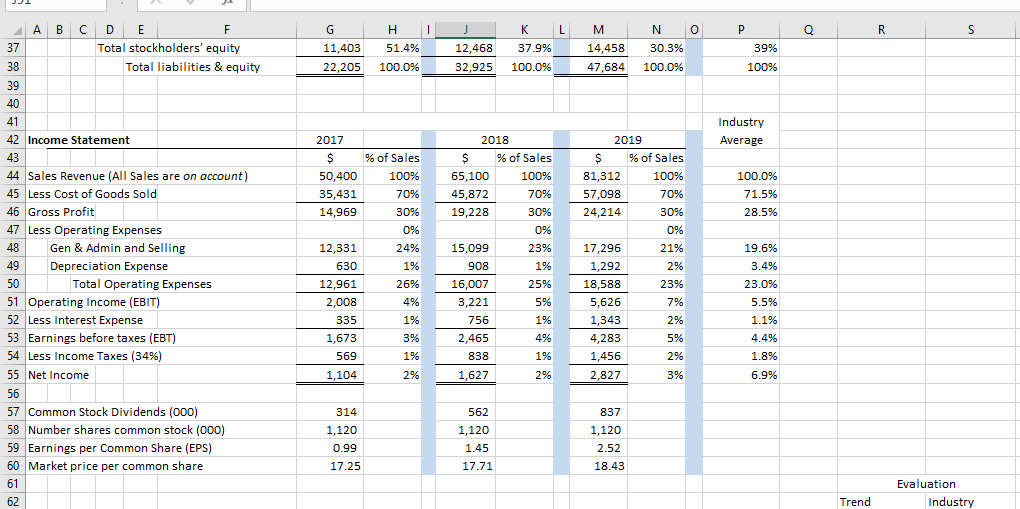
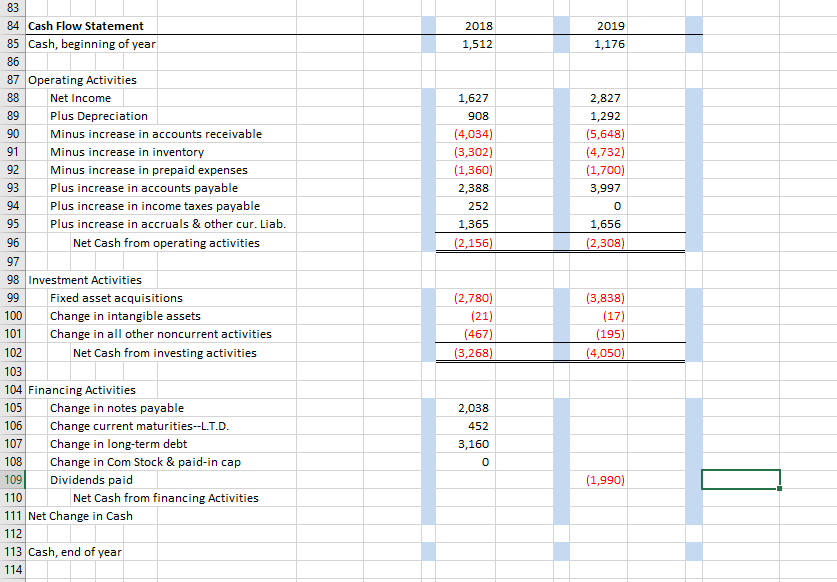
Please help with the Dividends Paid (cell 109).
Average 2017 $ 2018 % of TA 2019 % of TA % of TA $ $ 6% 20% 31% 5% 1,512 6.81% 6,237 28.09% 4,536 20.43% 3,780 17.02% 16,065 72.35% 6,300 28.37% 2,050 9.23% 4,250 19.14% 567 2.55% 1,323 5.96% 22,205 100.00% 1,176 3.57% 10,271 31.20% 7,838 23.81% 5,140 15.61% 24,425 74.18% 9,080 27.58% 2,958 8.98% 6,122 18.59% 588 1.79% 1,790 5.44% 32,925 100.00% 1,097 2.30% 15,919 33.38% 12,570 26.36% 6,840 14.34% 36,426 76.39% 12,918 27.09% 4,250 8.91% 8,668 18.18% 605 1.27% 1,985 4.16% 47,684 100.00% 62% 25% 9% 28% 4% 6% 100% 5.4% 8% 8 Balance Sheet (000) 9 10 Assets 11 Current assets 12 Cash 13 Accounts receivable 14 Inventories 15 Prepaid expenses 16 Total current assets 17 Gross fixed assets 18 Less: Accumulated depreciation 19 Net fixed assets 20 Intangible assets 21 All other noncurrent assets 22 Total Assets 23 Liabilities and Stockholders Equity 24 Current liabilities 25 Notes payable 26 Current maturities--L.T.D. 27 Accounts payable 28 Income taxes payable 29 Accruals & other Non Current Liabilities 30 Total current liabilities 31 Long-term debt 32 Total Liabilities 33 Stockholder's equity 34 Common stock 35 Paid-in capital 36 Retained earnings 37 Total stockholders' equity 38 Total liabilities & equity 39 40 41 42 Income Statement 43 44 Sales Revenue (All Sales are on account) 45 Less Cost of Goods Sold 46 Gross Profit 1,205 1,008 3,570 84 1,995 7,862 2,940 10,802 5% 16% 0% 9.8% 4.4% 18.1% 1.0% 10.2% 43.6% 3,243 1,460 5,958 336 3,360 14,357 6,100 20,457 4.5% 16.1% 0.4% 9.0% 35.4% 13.2% 48.6% 0.0% 15.1% 9.5% 26.8% 51.4% 100.0% 6,323 2,246 9,955 336 5,016 23,876 9,350 33,226 8% 13.3% 4.7% 20.9% 0.7% 10.5% 50.1% 19.6% 69.7% 0.0% 7.0% 4.4% 18.9% 36% 13% 61% 3,360 2,100 5,943 11,403 22,205 3,360 2,100 7,008 12,468 32,925 18.5% 62.1% 0.0% 10.2% 6.4% 21.3% 37.9% 3,360 2,100 8,998 14,458 47,684 30.3% 100.0% 39% 100% 100.0% Industry Average 2017 $ % of Sales 50,400 100% 35,431 70% 14,969 30% 2018 $ % of Sales 65,100 100% 45,872 70% 19,228 30% 2019 $ % of Sales 81,312 100% 57,098 70% 24,214 30% 100.0% 71.5% 28.5% 1 J L N 0 Q R S 37 C D E F Total stockholders' equity Total liabilities & equity G 11,403 22,205 H 51.4% 12,468 32,925 37.9% 100.0% M 14,458 47,684 30.3% 100.0% P 39% 100% 100.0% 38 39 40 41 Industry Average 2017 $ 50,400 35,431 14,969 % of Sales 100% 70% 30% 0% 100.0% 71.5% 28.5% 24% 1% 42 Income Statement 43 44 Sales Revenue (All Sales are on account) 45 Less Cost of Goods Sold 46 Gross Profit 47 Less Operating Expenses 48 Gen & Admin and Selling 49 Depreciation Expense 50 Total Operating Expenses 51 Operating Income (EBIT) 52 Less Interest Expense 53 Earnings before taxes (EBT) 54 Less Income Taxes (34%) 55 Net Income 56 57 Common Stock Dividends (000) 58 Number shares common stock (000) ) 59 Earnings per Common Share (EPS) 60 Market price per common share 61 62 12,331 630 12,961 2,008 335 1,673 569 1,104 2018 $ % of Sales 65,100 100% 45,872 70% 19,228 30% 0% 15,099 23% 908 1% 16,007 25% 3,221 5% 756 1% 2,465 4% 838 1% 1,627 2% 2019 $ % of Sales 81,312 100% 57,098 70% 24,214 30% 0% 17,296 21% 1,292 2% 18,588 23% 5,626 7% 1,343 2% 4,283 5% 1,456 2% 2,827 3% 26% 4% 1% 19.6% 3.4% 23.0% 5.5% 1.1% 4.4% 1.8% 6.9% 3% 1% 2% 314 1,120 0.99 17.25 562 1,120 1.45 17.71 837 1,120 2.52 18.43 Evaluation Industry Trend 2018 2019 1,176 1,512 1,627 908 (4,034) (3,302) (1,360) 2,388 252 1,365 (2,156) 2,827 1,292 (5,648) (4,732) (1,700) 3,997 0 1,656 (2,308) 83 84 Cash Flow Statement 85 Cash, beginning of year 86 87 Operating Activities 88 Net Income 89 Plus Depreciation 90 Minus increase in accounts receivable 91 Minus increase in inventory 92 Minus increase in prepaid expenses 93 Plus increase in accounts payable 94 Plus increase in income taxes payable 95 Plus increase in accruals & other cur. Liab. 96 Net Cash from operating activities 97 98 Investment Activities 99 Fixed asset acquisitions 100 Change in intangible assets 101 Change in all other noncurrent activities 102 Net Cash from investing activities 103 104 Financing Activities 105 Change in notes payable 106 Change current maturities--L.T.D. 107 Change in long-term debt 108 Change in Com Stock & paid-in cap 109 Dividends paid 110 Net Cash from financing Activities 111 Net Change in Cash 112 113 Cash, end of year 114 (2,780) (21) (467) (3,268) (3,838) (17) (195) (4,050) 2,038 452 3,160 0 (1,990)
Step by Step Solution
There are 3 Steps involved in it

Get step-by-step solutions from verified subject matter experts