

Question: Please help with the following QUESTION 13 A school administrator is looking at data for the first semester of school, comparing the number of daily
Please help with the following
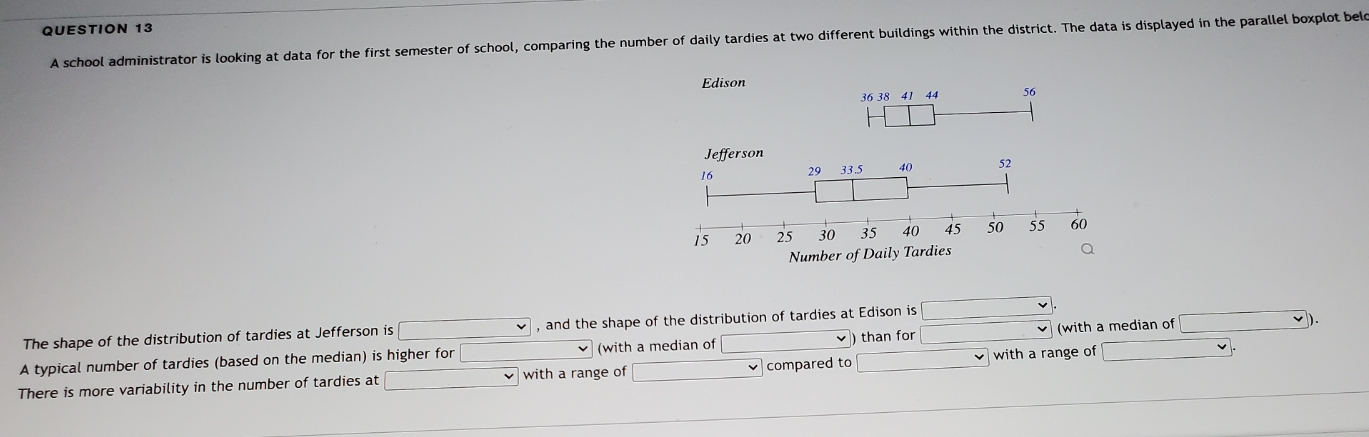
QUESTION 13 A school administrator is looking at data for the first semester of school, comparing the number of daily tardies at two different buildings within the district. The data is displayed in the parallel boxplot bel Edison 36 38 41 44 56 Jefferson 16 29 33.5 40 52 15 20 25 30 40 45 50 55 60 Number of Daily Tardies O The shape of the distribution of tardies at Jefferson is v, and the shape of the distribution of tardies at Edison is A typical number of tardies (based on the median) is higher for (with a median of v ) than for (with a median of There is more variability in the number of tardies at with a range of compared to with a range of VI
Step by Step Solution
There are 3 Steps involved in it

Get step-by-step solutions from verified subject matter experts