

Question: Please help with the following R Programming / R Studio question. I am stumped on how to do parts a and b. Data (A6DATA.csv): https://www.dropbox.com/s/gxa0yf2j7mnp1x4/A6DATA.csv?dl=0
Please help with the following R Programming / R Studio question. I am stumped on how to do parts a and b.
Data (A6DATA.csv): https://www.dropbox.com/s/gxa0yf2j7mnp1x4/A6DATA.csv?dl=0
Please note the following:
V1: variance of Wavelet Transformed image (continuous)
V2: skewness of Wavelet Transformed image (continuous)
V3: kurtosis of Wavelet Transformed image (continuous)
V4: entropy of image (continuous)
V5: class (0-forged, 1-genuine)
PART a:
Read A6DATA.csv file into RStudio.
Assemble logistic regression models with 60%/40%, 70%/30%, and 80%/20% partitioning into training and testing data sets using set.seed(222). Please summarize the training and testing accuracy, sensitivity and specificity for each and compare with 50%/50% performance using the table below. Please recommend and comment on the best model.
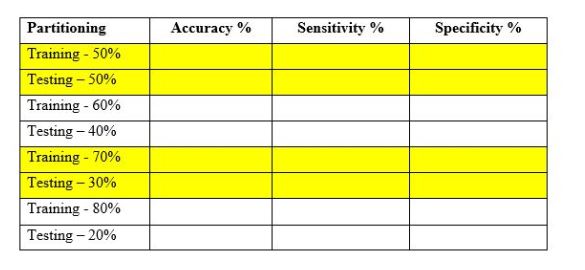
Partitioning Accuracy % Sensitivity % Specificity % Training - 50% Testing - 50% Training - 60% Testing - 40% Training - 70% Testing - 30% Training - 80% Testing - 20%
Step by Step Solution
There are 3 Steps involved in it

Get step-by-step solutions from verified subject matter experts