

Question: Please help with the following statistic question attached below. In tting a least squares line to n = 20 data points, the following quantities were
Please help with the following statistic question attached below.
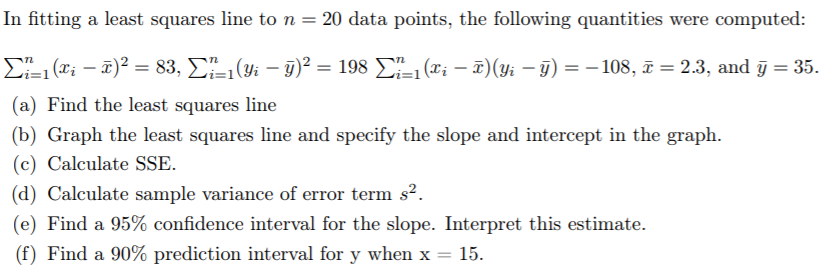
In tting a least squares line to n = 20 data points, the following quantities were oomputed: 23:1(25 at)2 = 83, 2:.\"=1(y.- g? = 198 22:1{zi i)(y,- g) = 108, f = 2.3, and g} = 35. (a) Find the least squares line {b} Graph the least squares line and specify the slope and intercept in the graph. ((3) Calculate SSE. 2 (d) Calculate sample variance of error term 3 . (e) Find a 95% condence interval for the slope. Interpret this estimate. (f) Find a 90% prediction interval for y when x = 15
Step by Step Solution
There are 3 Steps involved in it
1 Expert Approved Answer
Step: 1 Unlock

Question Has Been Solved by an Expert!
Get step-by-step solutions from verified subject matter experts
Step: 2 Unlock
Step: 3 Unlock