

Question: Please help with the formulas. FIN 3320 -- Excel Project Use Excel to evaluate the following capital budgeting project for the best, base, and worst
Please help with the formulas.
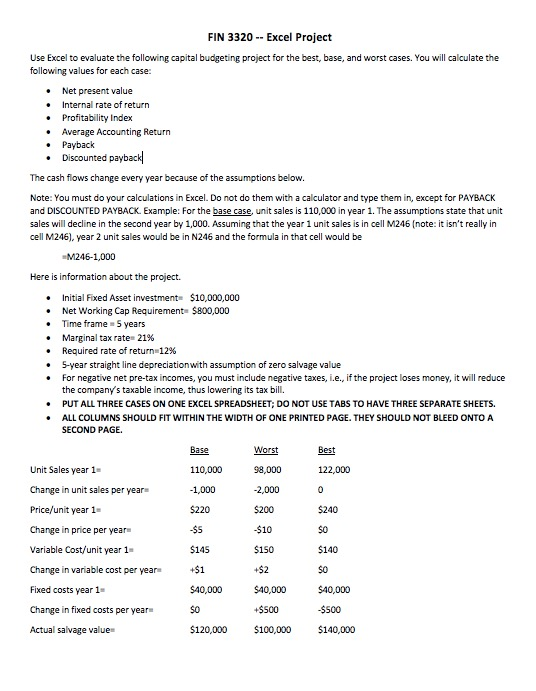
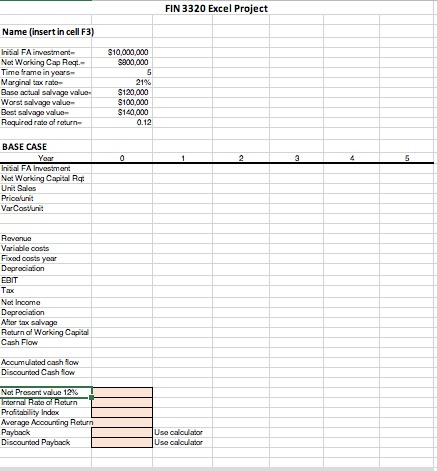
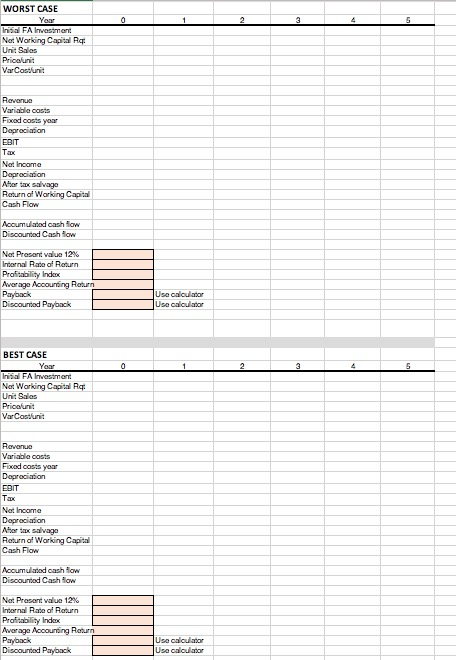
FIN 3320 -- Excel Project Use Excel to evaluate the following capital budgeting project for the best, base, and worst cases. You will calculate the following values for each case: Net present value Internal rate of return Profitability Index Average Accounting Return Payback Discounted payback The cash flows change every year because of the assumptions below. Note: You must do your calculations in Excel. Do not do them with a calculator and type them in, except for PAYBACK and DISCOUNTED PAYBACK Example: For the base case unit sales is 110,000 in year 1. The assumptions state that unit sales will decline in the second year by 1,000. Assuming that the year 1 unit sales is in cell M246 (note: it isn't really in cell M246), year 2 unit sales would be in N246 and the formula in that cell would be M246-1,000 Here is information about the project. Initial Fixed Asset investment $10,000,000 Net Working Cap Requirement $800,000 Time frame 5 years Marginal tax rate 21% Required rate of return 12% 5-year straight line depreciation with assumption of zero salvage value For negative net pre-tax incomes, you must include negative taxes, i.e., if the project loses money, it will reduce the company's taxable income, thus lowering its tax bill. PUT ALL THREE CASES ON ONE EXCEL SPREADSHEET; DO NOT USE TABS TO HAVE THREE SEPARATE SHEETS. ALL COLUMNS SHOULD FIT WITHIN THE WIDTH OF ONE PRINTED PAGE. THEY SHOULD NOT BLEED ONTO A SECOND PAGE Base Worst Best Unit Sales year 1 110,000 98,000 122,000 Change in unit sales per year -1,000 -2,000 Price/unit year 1 $220 $200 $240 Change in price per years -$5 -$10 Variable Cost/unit year 1 $145 $150 $140 Change in variable cost per year +51 +52 Foxed costs year 1 540,000 $40,000 $40,000 Change in foxed costs per year $0 $500 $500 Actual salvage value $120,000 $100,000 $140,000 $0 FIN 3320 Excel Project Name (insert in cel F3) $10.000.000 sann0 Inis FA investment Net Working Cap Roc Timetame in years Marginal tax rate Base actual salvage value Worst aage value Best salvage value Required rate of return $120.000 $100 000 $140.000 0.12 BASE CASE In FA Investment Not Working Capital Unit Sales Price unit VarCount Revenue Variable costs Fixed costs year Depreciation FIT Tax Not Income Depreciation Alor salvage Return of Working Capital Cash Flow Accumulated cash flow Discounted Cash fow Net Present Value 12% Torna Roturn Probability Index Average Accounting Rot. Payback Discounted Payback Use calculator WORST CASE IS FAI Not Working Capital R Unit Salas Pricant Var Costu Revenue Variable costs Foxed cost your Depreciation EBIT Net Income Depreciation Ahor salvage Return of Working Capital Cash Flow Accumulated cash flow Discounted Cash flow Not Present valun 12% Internal Rate of Return Profility Index Average Accounting Retur Payback Discounted Payback Use calculator Use calculator 0 1 BEST CASE Yag Ini FA Investment Not Working Capital Ra Unit Sales Pricelunt VarCount Revenue Variable costs Food costs year Depreciation COIT Tax Not Income Depreciation Ahora salvage Rotund Working Capital Cash Flow Accumulated cash flow Discounted Cash low Net Present Value 12% orna Rand Return Profitability Index Average Accounting Return Payback Discounted Payback Use calculator Use calculator FIN 3320 -- Excel Project Use Excel to evaluate the following capital budgeting project for the best, base, and worst cases. You will calculate the following values for each case: Net present value Internal rate of return Profitability Index Average Accounting Return Payback Discounted payback The cash flows change every year because of the assumptions below. Note: You must do your calculations in Excel. Do not do them with a calculator and type them in, except for PAYBACK and DISCOUNTED PAYBACK Example: For the base case unit sales is 110,000 in year 1. The assumptions state that unit sales will decline in the second year by 1,000. Assuming that the year 1 unit sales is in cell M246 (note: it isn't really in cell M246), year 2 unit sales would be in N246 and the formula in that cell would be M246-1,000 Here is information about the project. Initial Fixed Asset investment $10,000,000 Net Working Cap Requirement $800,000 Time frame 5 years Marginal tax rate 21% Required rate of return 12% 5-year straight line depreciation with assumption of zero salvage value For negative net pre-tax incomes, you must include negative taxes, i.e., if the project loses money, it will reduce the company's taxable income, thus lowering its tax bill. PUT ALL THREE CASES ON ONE EXCEL SPREADSHEET; DO NOT USE TABS TO HAVE THREE SEPARATE SHEETS. ALL COLUMNS SHOULD FIT WITHIN THE WIDTH OF ONE PRINTED PAGE. THEY SHOULD NOT BLEED ONTO A SECOND PAGE Base Worst Best Unit Sales year 1 110,000 98,000 122,000 Change in unit sales per year -1,000 -2,000 Price/unit year 1 $220 $200 $240 Change in price per years -$5 -$10 Variable Cost/unit year 1 $145 $150 $140 Change in variable cost per year +51 +52 Foxed costs year 1 540,000 $40,000 $40,000 Change in foxed costs per year $0 $500 $500 Actual salvage value $120,000 $100,000 $140,000 $0 FIN 3320 Excel Project Name (insert in cel F3) $10.000.000 sann0 Inis FA investment Net Working Cap Roc Timetame in years Marginal tax rate Base actual salvage value Worst aage value Best salvage value Required rate of return $120.000 $100 000 $140.000 0.12 BASE CASE In FA Investment Not Working Capital Unit Sales Price unit VarCount Revenue Variable costs Fixed costs year Depreciation FIT Tax Not Income Depreciation Alor salvage Return of Working Capital Cash Flow Accumulated cash flow Discounted Cash fow Net Present Value 12% Torna Roturn Probability Index Average Accounting Rot. Payback Discounted Payback Use calculator WORST CASE IS FAI Not Working Capital R Unit Salas Pricant Var Costu Revenue Variable costs Foxed cost your Depreciation EBIT Net Income Depreciation Ahor salvage Return of Working Capital Cash Flow Accumulated cash flow Discounted Cash flow Not Present valun 12% Internal Rate of Return Profility Index Average Accounting Retur Payback Discounted Payback Use calculator Use calculator 0 1 BEST CASE Yag Ini FA Investment Not Working Capital Ra Unit Sales Pricelunt VarCount Revenue Variable costs Food costs year Depreciation COIT Tax Not Income Depreciation Ahora salvage Rotund Working Capital Cash Flow Accumulated cash flow Discounted Cash low Net Present Value 12% orna Rand Return Profitability Index Average Accounting Return Payback Discounted Payback Use calculator Use calculator
Step by Step Solution
There are 3 Steps involved in it

Get step-by-step solutions from verified subject matter experts