

Question: Extra: I need to see the formula when using excel. FIN 3320 -- Excel Project Use Excel to evaluate the following capital budgeting project for
Extra: I need to see the formula when using excel.
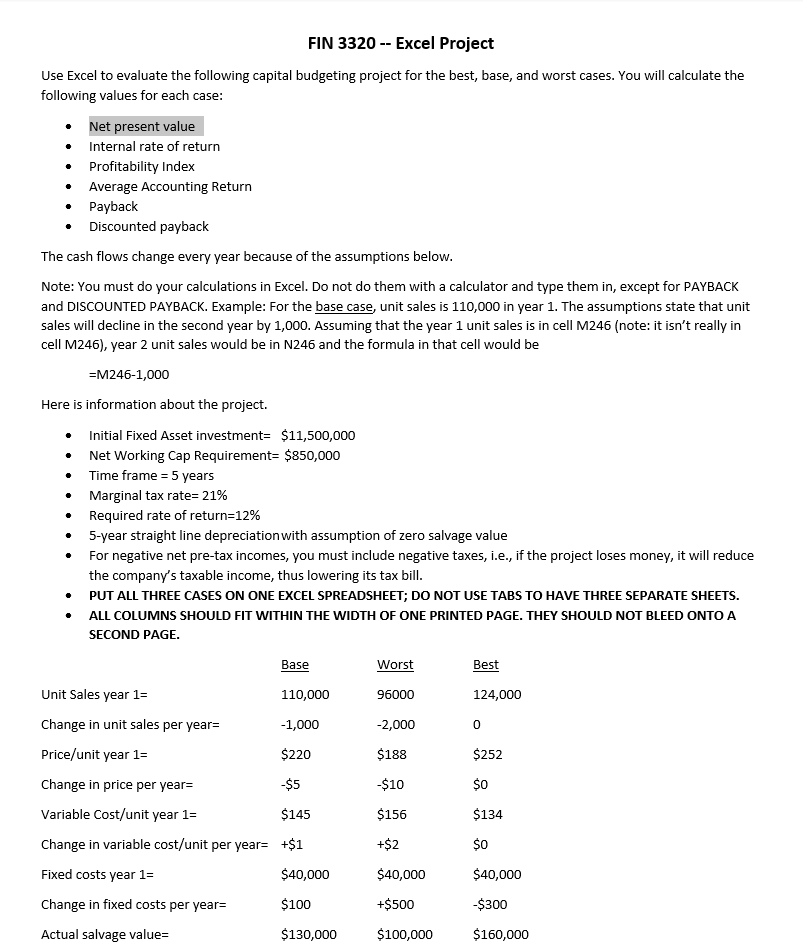
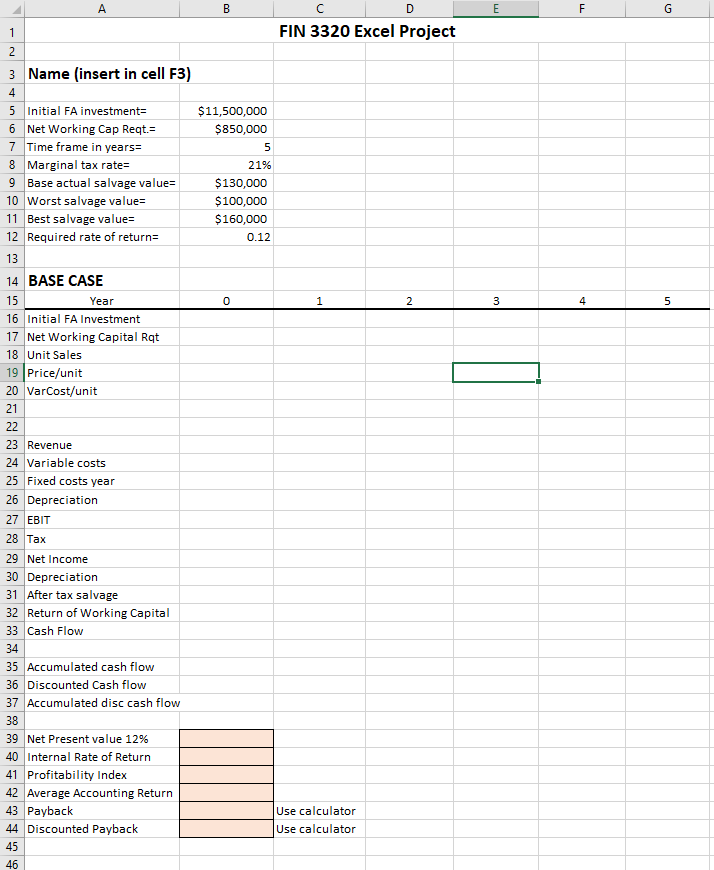
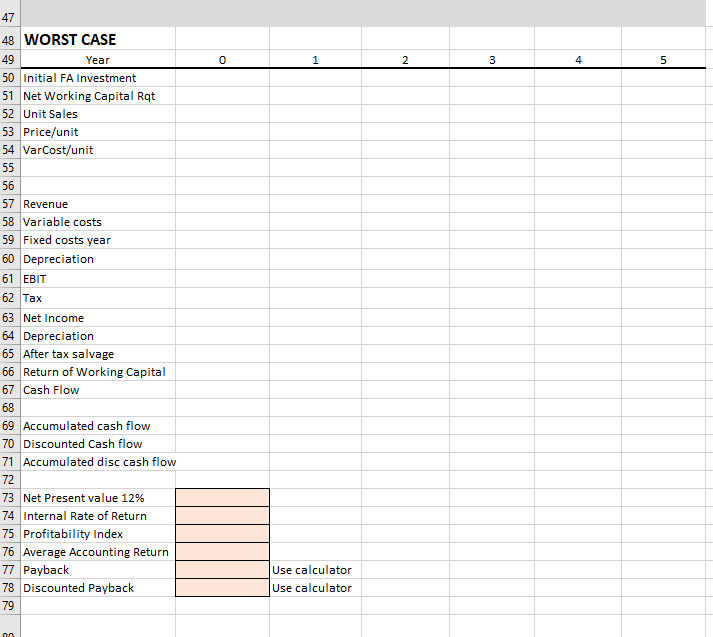
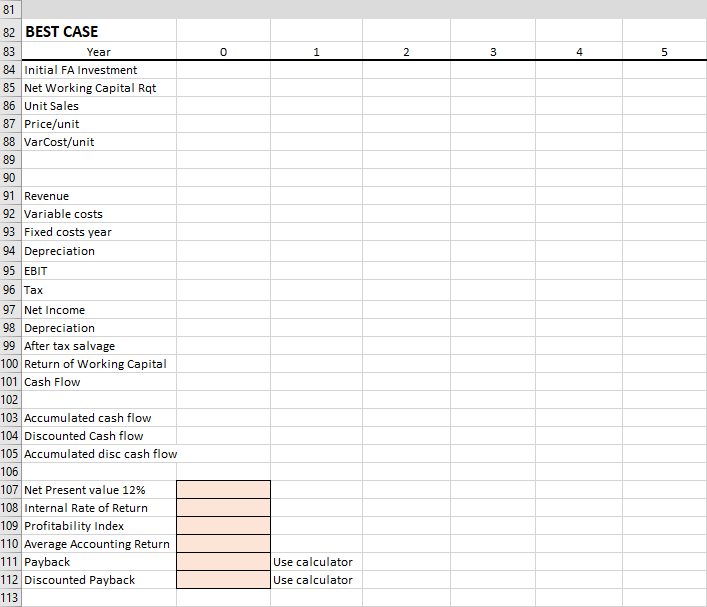
FIN 3320 -- Excel Project Use Excel to evaluate the following capital budgeting project for the best, base, and worst cases. You will calculate the following values for each case: Net present value Internal rate of return Profitability Index Average Accounting Return Payback Discounted payback The cash flows change every year because of the assumptions below. Note: You must do your calculations in Excel. Do not do them with a calculator and type them in, except for PAYBACK and DISCOUNTED PAYBACK. Example: For the base case, unit sales is 110,000 in year 1. The assumptions state that unit sales will decline in the second year by 1,000. Assuming that the year 1 unit sales is in cell M246 (note: it isn't really in cell M246), year 2 unit sales would be in N246 and the formula in that cell would be =M246-1,000 Here is information about the project. Initial Fixed Asset investment= $11,500,000 Net Working Cap Requirement= $850,000 Time frame = 5 years Marginal tax rate= 21% Required rate of return=12% 5-year straight line depreciation with assumption of zero salvage value For negative net pre-tax incomes, you must include negative taxes, i.e., if the project loses money, it will reduce the company's taxable income, thus lowering its tax bill. PUT ALL THREE CASES ON ONE EXCEL SPREADSHEET; DO NOT USE TABS TO HAVE THREE SEPARATE SHEETS. ALL COLUMNS SHOULD FIT WITHIN THE WIDTH OF ONE PRINTED PAGE. THEY SHOULD NOT BLEED ONTO A SECOND PAGE. Base Worst Best Unit Sales year 1= 110,000 96000 124,000 Change in unit sales per years -1,000 -2,000 $252 $188 $10 Price/unit year 1= $220 Change in price per years $5 Variable Cost/unit year 1= $145 Change in variable cost/unit per year= +$1 $156 $134 +$2 Fixed costs year 1= $40,000 $40,000 +$500 $40,000 -$300 Change in fixed costs per years $100 Actual salvage value= $130,000 $100,000 $160,000 FIN 3320 Excel Project 3 Name (insert in cell F3) $11,500,000 $850,000 5 Initial FA investment= 6 Net Working Cap Reqt. 7 Time frame in years= 8 Marginal tax rate= 9 Base actual salvage value= 10 Worst salvage value= 11 Best salvage value= 12 Required rate of return= 21% $130,000 $100,000 $160,000 0.12 13 2 3 4 5 14 BASE CASE 15 Year 16 Initial FA Investment 17 Net Working Capital Rat 18 Unit Sales 19 Price/unit 20 VarCost/unit 23 Revenue 24 Variable costs 25 Fixed costs year 26 Depreciation 27 EBIT 28 Tax 29 Net Income 30 Depreciation 31 After tax salvage 32 Return of Working Capital 33 Cash Flow 35 Accumulated cash flow 36 Discounted Cash flow 37 Accumulated disc cash flow 39 Net Present value 12% 40 Internal Rate of Return 41 Profitability Index 42 Average Accounting Return 43 Payback 44 Discounted Payback 45 46 Use calculator Use calculator 3 48 WORST CASE 49 Year 50 Initial FA Investment 51 Net Working Capital Rat 52 Unit Sales 53 Price/unit 54 VarCost/unit 56 57 Revenue 58 Variable costs 59 Fixed costs year 60 Depreciation 61 EBIT 62 Tax 63 Net Income 64 Depreciation 65 After tax salvage 66 Return of Working Capital 67 Cash Flow 68 69 Accumulated cash flow 70 Discounted Cash flow 71 Accumulated disc cash flow 72 73 Net Present value 12% 74 Internal Rate of Return 75 Profitability Index 76 Average Accounting Return 77 Payback 78 Discounted Payback Use calculator Use calculator 82 BEST CASE 83 Year 84 Initial FA Investment 85 Net Working Capital Rat 86 Unit Sales 87 Price/unit 88 VarCost/unit 89 90 91 Revenue 92 Variable costs 93 Fixed costs year 94 Depreciation 95 EBIT 96 Tax 97 Net Income 98 Depreciation 99 After tax salvage 100 Return of Working Capital 101 Cash Flow 102 103 Accumulated cash flow 104 Discounted Cash flow 105 Accumulated disc cash flow 106 107 Net Present value 12% 108 Internal Rate of Return 109 Profitability Index 110 Average Accounting Return 111 Payback 112 Discounted Payback 113 Use calculator Use calculator
Step by Step Solution
There are 3 Steps involved in it

Get step-by-step solutions from verified subject matter experts