

Question: Please help with the Python code problem Exercise:- Draw a line graph that shows the population of China and Population of Vietnam. Population of China
Please help with the Python code problem


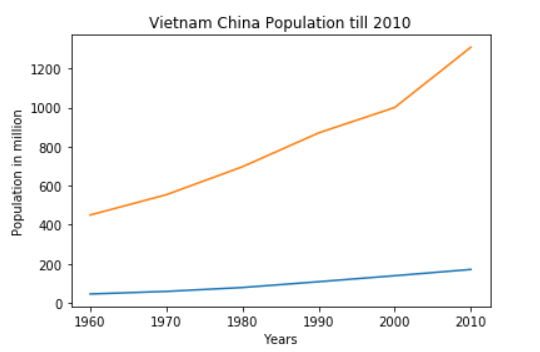
Exercise:- Draw a line graph that shows the population of China and Population of Vietnam. Population of China by year:- year = [1960, 1970, 1980, 1990, 2000, 2010) pop_china = [449.48, 553.57, 696.783, 870.133, 1000.4, 1309.1] pop_vietnam IT [44.91, 58.09, 78.07, 107.7, 138.5, 170.6] Vietnam China Population till 2010 1200 1000 800 Population in million 600 400 200 0 1960 1970 2000 2010 1980 1990 Years
Step by Step Solution
There are 3 Steps involved in it
1 Expert Approved Answer
Step: 1 Unlock

Question Has Been Solved by an Expert!
Get step-by-step solutions from verified subject matter experts
Step: 2 Unlock
Step: 3 Unlock