

Question: Question 1 Explain why your company competes in a world market arena characterized by global competition and not multi-country competition. Chapter 7 . Strategies for
Question 1
Explain why your company competes in a world market arena characterized by global competition and not multi-country competition.
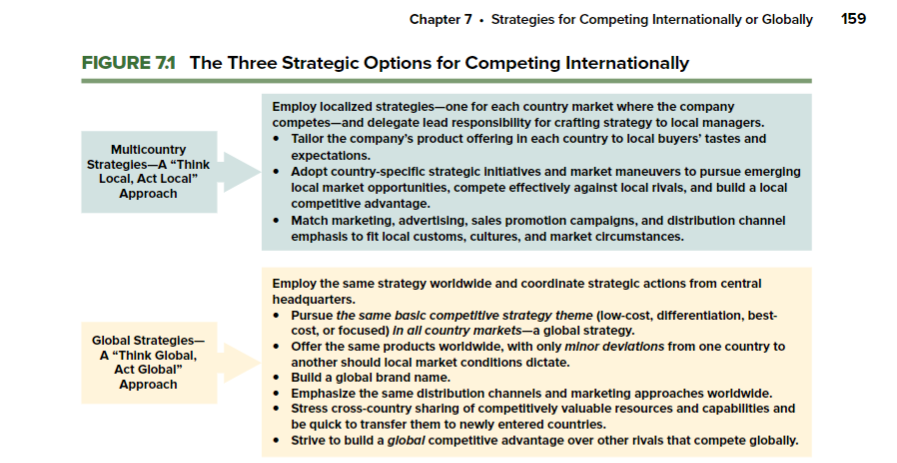
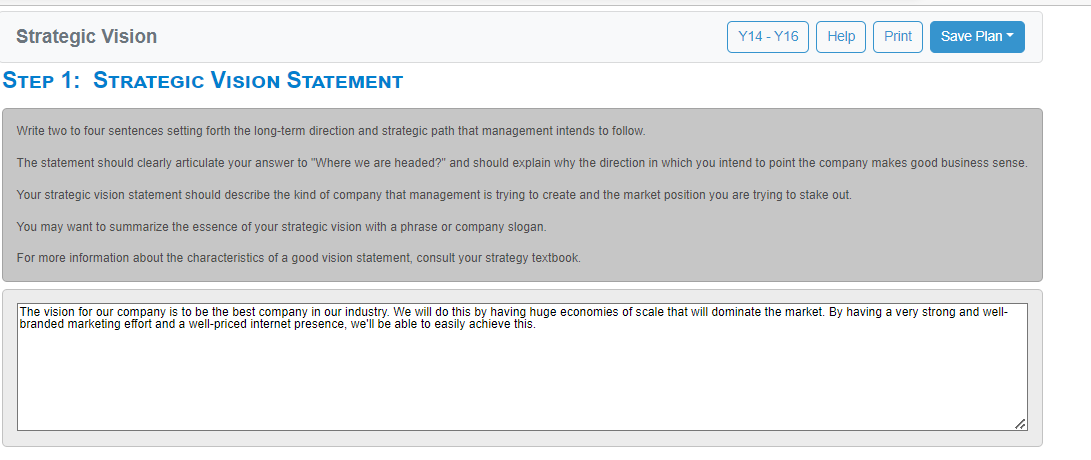
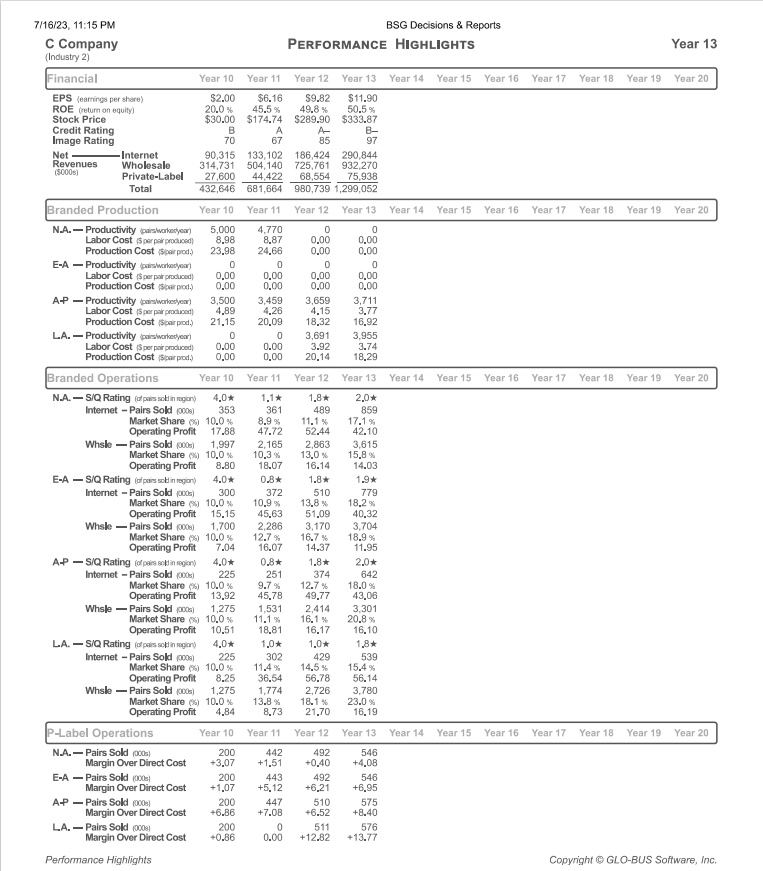
Chapter 7 . Strategies for Competing Internationally or Globally 159 FIGURE 71 The Three Strategic Options for Competing Internationally Employ localized strategles-one for each country market where the company competes-and delegate lead responsibility for crafting strategy to local managers. . Tallor the company's product offering In each country to local buyers' tastes and Multicountry expectations. Strategles-A "Think Local, Act Local" . Adopt country-specific strategic Initiatives and market maneuvers to pursue emerging Approach local market opportunities, compete effectively against local rivals, and build a local competitive advantage. Match marketing, advertising, sales promotion campaigns, and distribution channel emphasis to fit local customs, cultures, and market circumstances. Employ the same strategy worldwide and coordinate strategic actions from central headquarters. . Pursue the same basic competitive strategy theme (low-cost, differentiation, best- cost, or focused) In all country markets-a global strategy. Global Strategies- . A "Think Global, Offer the same products worldwide, with only minor deviations from one country to Act Global" another should local market conditions dictate. Approach Build a global brand name. Emphasize the same distribution channels and marketing approaches worldwide. Stress cross-country sharing of competitively valuable resources and capabilities and be quick to transfer them to newly entered countries. . Strive to build a global competitive advantage over other rivals that compete globally.Strategic Vision Y14 - Y16 Help Print Save Plan STEP 1: STRATEGIC VISION STATEMENT Write two to four sentences setting forth the long-term direction and strategic path that management intends to follow. The statement should clearly articulate your answer to "Where we are headed?" and should explain why the direction in which you intend to point the company makes good business sense. Your strategic vision statement should describe the kind of company that management is trying to create and the market position you are trying to stake out. You may want to summarize the essence of your strategic vision with a phrase or company slogan. For more information about the characteristics of a good vision statement, consult your strategy textbook. The vision for our company is to be the best company in our industry. We will do this by having huge economies of scale that will dominate the market. By having a very strong and well- branded marketing effort and a well-priced internet presence, we'll be able to easily achieve this.7/16/23, 11:15 PM BSG Decisions & Reports C Company PERFORMANCE HIGHLIGHTS Year 13 (Industry 2) Financial Year 10 Year 11 Year 12 Year 13 Year 14 Year 15 Year 16 Year 17 Year 18 Year 19 Year 20 EPS (earnings per share) $2.00 $6.16 $9.82 $11.90 ROE (return on equity) 20.0% 45.5 % 49.8% 50.5 % Stock Price $30.00 $174.74 $289.90 $333.87 Credit Rating B A A Image Rating 70 85 Net Internet 90,315 133, 102 186,424 290,844 Revenues Wholesale 314,731 504,140 725,761 932,270 (5000s) Private-Label 27,600 44,422 68,554 75,938 Total 432,646 681,664 980,739 1,299,052 Branded Production Year 10 Year 11 Year 12 Year 13 Year 14 Year 15 Year 16 Year 17 Year 18 Year 19 Year 20 N.A. - Productivity (pairs/workedyour) 5,000 1,770 Labor Cost ($ perpair produced) 8.98 8.87 0.00 0.00 Production Cost (pairprod.) 23.98 24.66 0.00 0.00 E-A - Productivity (pairsworksyear) 0 0 0 Labor Cost ($ par pair produced) 0.DO 0.00 0.00 0.00 Production Cost (pairpod.) 0.00 0.00 0.00 0.00 A-P - Productivity (pairsworkedyear) 3.500 3.459 3.659 3,71 Labor Cost ($ par pair produced) 4.89 4.26 4.15 3.77 Sipair prod.) 21.15 20.09 18.32 16,92 LA. - Productivity (pairs/workedyear) 3.691 3.955 Labor Cost ($perpair produced) 0.00 0.00 3.92 3.74 Production Cost ($pairpod.) 0.00 0.00 20.14 18.29 Branded Operations Year 10 Year 11 Year 12 Year 13 Year 14 Year 15 Year 16 Year 17 Year 18 Year 19 Year 20 N.A. - S/Q Rating jolpairs sold in region) 1.0* 1.1* 2.0* Internet - Pairs Sold poops) 353 361 489 859 Market Share (9) 10.0% 8.9 9 11.1 % 17.1 Operating Profit 17.68 47.72 62.44 42.10 Whale - Pairs Sold (poos) 1.997 2.165 2.863 3.615 Market Share (x) 10.0 % 10.3%% 13.0% 15.8 Operating Profit 8.80 18.07 16.14 14.0 E-A - S/Q Rating [of pairs sold in region) 4.0* 0.8* 1.8* 1.9* Internet - Pairs Sold jobs) 300 372 510 779 Market Share @ 10.0 % 10.9% 3.8 % 18.2%% Operating Profit 15.15 45.63 51.09 40.32 Whale - Pairs Sold pops) 1,700 2,286 3,170 3,704 Market Share (9) 10.0% 12.7% 16.7 18.9% Operating Profit 7.04 16.07 14.37 11.95 A-P - S/Q Rating forpais sold in myion 4.0# 0.84 1.8# 2.04 Internet - Pairs Sold jobs) 225 251 374 647 Market Share (9 10.0% 9.7% 12.7 % 18.0 Operating Profit 13.92 45.78 49.77 43.0 Whale Pairs Sold (poos) 1,275 1,531 2,41 3,301 Market Share ~%) 10.0% 11.1 % 16.1 % 20.8% Operating Profit 10.51 18.81 16.17 16.10 LA. - S/Q Rating forpairs sold in myion) 4.0# 1.0* 1.0# 1.8* Internet - Pairs Sold (poos] 225 302 429 539 Market Share (3) 10.0% 11.4 % 14.5 % 15.4 % Operating Profit 8.25 36.54 56.78 56.14 Whale - Pairs Sold (poos) 1,275 1,774 2.726 3,780 Market Share () 10.0 % 13.8% 18.1 % 23.0%% Operating Profit 4.84 8.73 21.70 16.19 -Label Operations Year 10 Year 11 Year 12 Year 13 Year 14 Year 15 Year 16 Year 17 Year 18 Year 19 Year 20 N.A.- Pairs Sold (poos) 200 442 492 546 Margin Over Direct Cost +3.07 -1.51 -0.40 +4,08 E-A - Pairs Sold (000s) 200 443 492 546 Margin Over Direct Cost +1.07 -5.12 .6.21 +6.95 Pairs Sold (ooos) 200 447 510 575 Margin Over Direct Cost +6.86 +7.08 +6.52 +8.40 LA. - Pairs Sold (0pos) 200 511 576 Margin Over Direct Cost +0.86 0.00 +12.82 +13.77 Performance Highlights Copyright @ GLO-BUS Software, Inc
Step by Step Solution
There are 3 Steps involved in it

Get step-by-step solutions from verified subject matter experts